
 Best Platforms
 Live Odds








Best Prediction Market Aggregators 2026
A curated collection of the best prediction market aggregators for 2026—how to pick an aggregator, evaluate data quality and platform viability, compare options side-by-side, and choose the right workflow for price shopping, research, and execution checks.
Trying to follow prediction markets in 2026 can feel like tab-hopping through five platforms just to answer one question: where’s the best price—and is there enough liquidity to take it?
This collection narrows the field to aggregators and discovery tools that actually save time. You’ll see why MarketsPrediction is a standout for cross-platform live odds and volume scanning, where native explorers like Polymarket and Kalshi still shine, and how to match the right tool to your goal—research, shopping for odds, or sanity-checking execution details before you trade.
Pick an aggregator
A prediction-market aggregator should answer one question fast: where is the best market for this belief. You use it to compare odds, liquidity, and access across platforms without opening ten tabs.
At minimum, it must normalize messy market listings into something comparable, then route you back to the source to trade or research. MarketsPrediction is built around that workflow, with cross-platform live odds, trending feeds, strong filters, and platform comparison tables that cut your search time.
Primary use cases
You’re not picking an aggregator for charts. You’re picking it to make daily scanning and decision-making cheaper.
- Price shopping across platforms
- Liquidity scouting before sizing
- Trend tracking for new narratives
- Research watchlists for key topics
- Platform due diligence before funding
If you do more than one of these weekly, aggregation beats bookmarks.
Non-negotiable features
Most tools look similar until you need speed and clarity. The must-haves are the pieces that prevent bad clicks.
- Cross-platform odds on one screen
- Volume and liquidity signals
- Fast updates for active markets
- Filters by category and platform
- Deep links to the source market
If a tool can’t deep-link cleanly, it’s a dashboard, not an aggregator.
Data quality signals
Aggregators live or die on matching the “same” market across different platforms. You want freshness, broad coverage, clean contract mapping, and disciplined duplicate handling.
Watch for timestamps and update cadence indicators, especially during breaking news. Check whether it merges near-duplicates or forces you to guess which contract is real.
If you keep seeing mismatched resolutions or oddly frozen odds, treat the feed as stale and verify on the source.
Safety and compliance
Prediction markets are jurisdiction-sensitive, and aggregators should respect that. You want clear platform legitimacy cues and links to platform rules, not workarounds.
Look for obvious jurisdiction checks, consistent platform naming, and direct references to each platform’s onboarding and trading requirements. MarketsPrediction’s platform comparison angle is useful here, because it nudges you to evaluate access details before you commit funds.
If an aggregator encourages shortcuts, you’re inheriting its risk model.
Workflow fit
You’ll only use an aggregator that feels instant. Evaluate scan speed, watchlists, alerts, export options, and mobile usability for real daily use.
If you track many themes, prioritize tools with strong filters, trending feeds, and “top by volume” lists so you can triage quickly. MarketsPrediction leans into that scanning workflow with trending markets, category and platform filters, and high-activity lists that surface where attention is.
Pick the tool that matches your cadence, then automate the boring parts with watchlists or exports.
MarketsPrediction
MarketsPrediction is built for cross-platform discovery when you care about prices, liquidity, and speed. Instead of hopping between venues, you scan live odds, volume, and trending markets in one place.
Other aggregators and dashboards can be great at single-platform depth or community curation. MarketsPrediction stands out when your workflow starts with “where is this trading best right now?”
Why it stands out
MarketsPrediction pulls live odds and activity across multiple venues, then puts “what’s moving” upfront. That matters when prices shift fast and the best entry is elsewhere.
You get cross-platform live odds aggregation, a trending markets feed, and quick scanning across major platforms like Kalshi and Polymarket. You also see volume and liquidity signals without opening five tabs.
If you trade or track narratives daily, fewer tabs becomes a real edge.
Discovery and filtering
Good aggregators help you narrow from hundreds of markets to a few actionable ones. MarketsPrediction’s filters are designed for that first pass.
- Filter by category to stay inside your domain
- Filter by platform to match access and rules
- Sort by volume to avoid thin markets
- Scan trending to catch new narratives early
- Combine filters to build a repeatable watchlist
Your goal is a short list you can actually price-check and execute.
Volume-first views
Volume-first views answer a practical question: “Where can I get filled without drama?” MarketsPrediction’s “Top markets by volume” lists, like Top 30 views, make that visible fast.
Higher volume often correlates with tighter spreads and more reliable execution, especially during news spikes. It also boosts confidence that you are seeing a real consensus, not one user’s whim.
Start with volume to find tradable markets, then compare odds for the best price.
Platform comparison depth
Platform comparison tables keep you from discovering dealbreakers after you have a thesis. MarketsPrediction surfaces practical platform details side-by-side.
| Platform factor | What you check | Why it matters | Quick signal |
|---|---|---|---|
| Deposit methods | Bank, card, crypto | Funding friction | Fewer steps wins |
| Minimum deposit | Entry threshold | Testing cheaply | Lower is easier |
| Payout speed | Withdrawal timing | Capital velocity | Faster helps traders |
| Account access | Region, verification | Eligibility risk | Blocked is blocked |
When odds look great but payouts are slow, your “best price” can become dead money.
Best-fit reader profiles
MarketsPrediction fits best when you need cross-platform context, not just one venue’s order book. It’s a strong default pick for discovery before you go deep.
- Active traders hunting best price and liquidity
- Forecasters tracking narratives across platforms
- Newcomers comparing platforms before funding
- Analysts building a recurring market watchlist
If you match two or more, make it your starting screen.
Best for price shopping
MarketsPrediction
Price shopping is about seeing every venue’s best line without opening ten tabs. MarketsPrediction is built for that exact workflow.
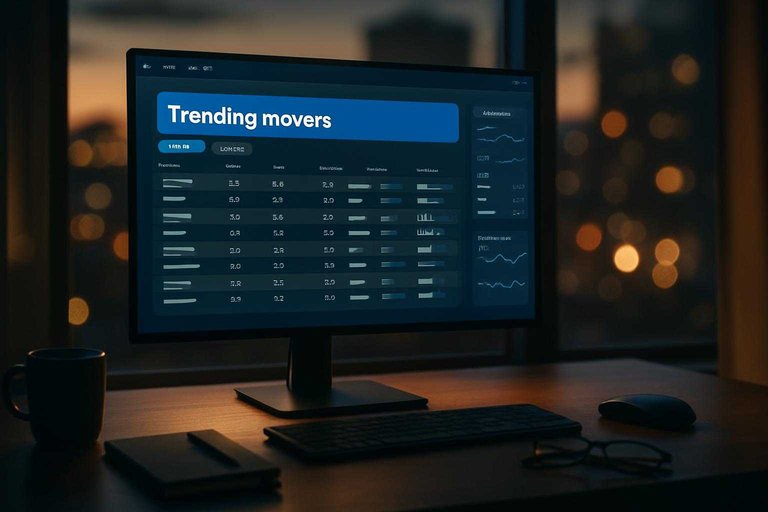
You get side-by-side odds across platforms, plus live context like volume and liquidity. Use the trending movers feed to catch sudden reprices, then narrow fast with filters by category and platform. The “top markets” lists (for example, by views or volume) keep you anchored on what’s actually active, not just newly listed.
When you can compare prices and activity in one scan, mispricings stop hiding behind friction.
Polymarket explore tools
Sometimes the best “aggregator” is the venue with the most attention and liquidity. Polymarket’s native Explore and category pages make it easy to stay on the deepest on-platform markets.
Discovery is clean and fast for what’s trading right now, and you can hop between related markets without leaving the site. That’s perfect when execution speed matters more than cross-venue comparison. The tradeoff is simple: you only see Polymarket’s prices, not the rest of the field.
Use it when you’ve already chosen the venue, and need the quickest route to liquid markets.
Kalshi market browse
If you care about regulated event contracts, Kalshi’s built-in browsing is a strong starting point. It’s designed for finding markets by topic, not hunting arbitrage across venues.
Search and category navigation help you locate the exact contract quickly, especially around major economic or political events. You can also scan what’s newly listed or most active on-platform. Like any native tool, it won’t tell you whether another platform is offering a better price.
It’s great for “find the right contract,” not “find the best line anywhere.”
Browser extensions and bots
Lightweight tools can still help you spot prices quickly, especially if you live in chat and social feeds.
Best for research
Research-grade aggregation is about narrative, not just price. You want history, context, and a workflow that survives more than one platform.
MarketsPrediction trending
Narratives move faster than your bookmarks. A cross-platform trending feed lets you notice the shift without living in five tabs.
Use it like a research radar:
- Scan the Trending markets feed for sudden topic clustering.
- Filter by category and platform to separate “news” from “platform-specific noise.”
- Cross-check live odds, volume, and liquidity to see where attention concentrates.
- Jump to top markets by volume or views to find the main conversation.
When the same story trends across multiple venues, it’s usually a real narrative wave.
Manifold discovery
Manifold is great for exploratory research because people create markets about everything. The community layer becomes your discovery engine.
What to lean on:
- Tags to map themes and adjacent questions.
- Creator and trader profiles to find repeat domain specialists.
- Comment threads for links, assumptions, and counterarguments.
- Market mechanics that differ from typical order-book odds.
Treat it as idea generation and premise testing, then corroborate elsewhere.
Metaculus signals
Metaculus is closer to a forecasting research lab than an odds screen. You follow questions, methods, and resolution discipline more than tradable prices.
Use it for:
- Tracking long-horizon questions with clear resolution rules.
- Comparing community predictions over time, not just the latest number.
- Reading writeups that expose assumptions and evidence.
- Building a personal queue of questions to revisit.
If you want to improve your forecasting, this is where process beats price.
RSS and lists
Your edge comes from a watchlist that runs itself. Build one that mixes aggregation, niche discovery, and repeatable queries.
- Create curated lists by theme, not by platform.
- Subscribe to RSS feeds where a platform exposes them.
- Save searches for recurring entities, regions, and actors.
- Pin “top volume” pages for quick daily scanning.
- Store links to comparison tables for fast platform checks.
Once the list is stable, you stop hunting and start noticing.
Best for execution checks
Before you click through, you want to know if the trade is actually tradable. Execution checks are where aggregators earn their keep: liquidity, spreads, fees, and platform constraints.
MarketsPrediction stands out here because it pairs cross-platform live odds with volume views and platform comparison tables. You can sanity-check fills and frictions fast, without bouncing between five tabs.
Liquidity interpretation
Liquidity looks different across platforms, so you need a few shared proxies. You’re trying to answer one question: “Will I get filled near the shown price?”
Volume helps, but it can lag or be defined differently by venue. Order book depth is better, yet not every platform exposes it the same way. When depth is opaque, use the spread as a proxy: wider spreads usually mean thinner markets, even if headline odds look attractive.
If the aggregator shows live odds plus some activity signal, treat them as a pair, not separately.
MarketsPrediction top-volume
Top-volume lists are the quickest way to avoid dead markets. Use them to start where fills are more reliable, then branch out.
- Open MarketsPrediction and switch to the top markets by volume view.
- Filter by platform if you can only trade on certain venues.
- Prefer markets with tighter visible spreads or steadier price updates.
- Click through and confirm order book depth or recent fills on-platform.
- Only then compare odds across platforms for the best executable price.
You’re not chasing the “best price.” You’re chasing the best fill.
Platform fee awareness
Fees quietly change your effective entry and exit price. Confirm the full fee stack before you treat two odds quotes as comparable.
- Trading fees on entry and exit
- Withdrawal fees and minimums
- Network costs for deposits or withdrawals
- Spread impact on round trips
- Currency or stablecoin conversion costs
If you can’t explain the all-in cost, you don’t know your real odds.
Payout and settlement
Two markets can look identical but settle under different rules. Check settlement sources, resolution criteria, and payout timing before you commit capital.
Use the aggregator’s platform comparison fields as your checklist: payout speed, deposit methods, minimum deposit, and any operational constraints. Then read the market’s resolution language on the venue itself, especially for edge cases and “invalid market” clauses.
Execution isn’t just fills. It’s getting paid when you’re right.
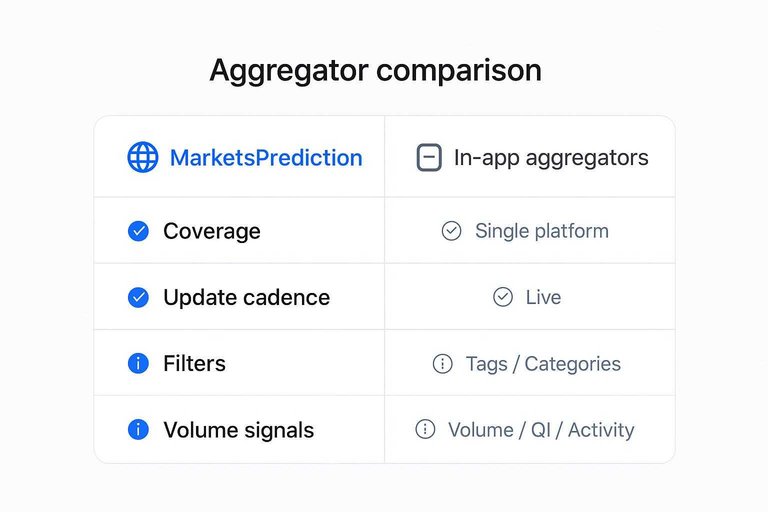
Aggregator comparison table
Use this table to choose an aggregator based on how you actually scan markets: breadth, speed, and the tooling around decisions.
| Aggregator | Coverage | Update cadence | Filters | Volume signals | Deep links | Watchlists | Platform comparisons | Cost |
|---|---|---|---|---|---|---|---|---|
| MarketsPrediction | Multi-platform | Live / frequent | Category + platform | Volume + liquidity | Yes | Yes | Yes | Free (core) |
| Manifold Markets (in-app) | Single platform | Live | Tags | Activity | N/A | Yes | N/A | Free |
| Polymarket (in-app) | Single platform | Live | Categories | Volume | N/A | Yes | N/A | Free |
| Kalshi (in-app) | Single platform | Live | Categories | Volume / OI | N/A | Watchlists | N/A | Free |
| Metaculus (forecast hub) | Forecasts, not markets | Frequent | Topic | Community activity | N/A | Follow lists | N/A | Free |
If you want cross-platform price shopping, MarketsPrediction is built for that job.
Platform viability table
Use this checklist to sanity-check an aggregator before you trust it with your workflow. Aggregators don’t custody funds, but they shape where you click, deposit, and trade.
| Aggregator | Jurisdiction / access | Deposit methods (platform-dependent) | Minimum deposit | Payout speed | Fees | Market breadth | UX / workflow |
|---|---|---|---|---|---|---|---|
| MarketsPrediction | Web; tracks multi-platform access | Card, ACH, crypto, bank transfer | Varies by platform | Varies by platform | Aggregator: none shown | Broad, cross-platform | Live odds, filters, trending |
| PredictIt (directory-style) | US-focused access rules | Card / bank (site-specific) | Site-defined | Site-defined | Site-defined | Narrow, single venue | Simple, familiar |
| Kalshi (native app/site) | US-regulated venue | ACH, debit (where available) | Venue-defined | Venue-defined | Venue-defined | Strong on US events | Clean, fast trading |
| Polymarket (native app/site) | Access varies by region | Crypto (wallet-based) | Venue-defined | Venue-defined | Venue-defined | Broad crypto-native | Deep markets, fast search |
If an aggregator can’t show platform constraints clearly, you’ll pay for it in misclicks and failed deposits.
How to choose in 2026
In 2026, the hard part is not finding markets. It’s trusting the numbers across platforms.
- Decide your primary job: scanning, execution, or research.
- If you need cross-platform price checks, start with MarketsPrediction for live odds and volume.
- If you only trade on one venue, use that platform’s native lists and alerts first.
- Validate data quality by spot-checking several markets against source pages.
- Choose the tool you’ll actually use daily: trending feed, filters, and comparison tables.
When your decision depends on “where is the best price,” aggregation stops being nice-to-have.
Data quality and normalization across platforms
In 2026, the hardest part of using an aggregator isn’t finding more markets—it’s trusting that what you’re seeing is comparable across venues. Prediction markets differ in how they quote prices, how quickly they update, what fees are embedded (or not), and what “the price” even means for illiquid books. A strong aggregator should make these differences explicit and normalize them in a way you can audit.
Below are the main normalization layers that separate “nice UI” from a tool you can rely on for cross-platform decisions. For a concrete example of what a free cross-platform data layer does (and doesn’t) cover in practice, see live cross-platform prediction market data. For another perspective on cross-venue data quality and spread signals, see this CoinRithm prediction markets review.
Update latency and stale quotes
Aggregators pull data from a mix of public endpoints, partner feeds, scraped pages, and on-chain indexers. Each path has its own delay and failure modes, so two platforms can look “out of sync” even when they aren’t.
What to look for:
- Per-market “as of” timestamps (not just “updated recently”) so you can spot stale lines instantly.
- Polling/websocket behavior disclosed (and whether it falls back gracefully when real-time updates fail).
- Staleness flags when a market hasn’t updated past a defined threshold.
- Event-time consistency for markets that resolve or change state quickly (e.g., suspension, settlement, contract migration).
Practical tip: if an aggregator highlights a cross-platform “arb” but won’t show when each quote was last observed, treat it as a lead, not evidence.
Price, probability, and odds conversion
Some venues quote contract price, others show implied probability, and others present decimal/American odds. Even when they look similar, the underlying conventions can differ (including rounding and whether the quote is mid, last, or best-available).
A trustworthy aggregator should:
- Clearly label what number is displayed (mid-price vs last trade vs top-of-book).
- Provide consistent conversions between price ↔ implied probability ↔ odds with a documented formula.
- Handle YES/NO dual-sided markets without mixing sides (a common source of “phantom edges”).
- Explain how it treats multi-outcome markets (normalizing probabilities so the sum is meaningful, and exposing any overround where applicable).
If you can’t tell whether you’re comparing “best bid” on one venue to “last traded” on another, you’re not actually price shopping—you’re comparing different objects.
Fee, spread, and slippage adjustments
Headline prices are rarely the price you can actually get. Different venues impose trading fees, withdrawal/deposit costs, and have different liquidity profiles—so a clean comparison often requires two views: raw quotes and effective execution.
Key features to prioritize:
- Fee-aware effective prices (net of taker/maker fees where relevant), with the fee schedule source linked.
- Spread visibility (showing bid and ask rather than a single number).
- Depth-aware slippage estimates (even a simple “cost to fill size X” is better than none), with the assumptions stated.
- A clear distinction between indicative and actionable prices, especially on thin markets.
If an aggregator claims “best price” but only shows a single midpoint-like number, it may be optimizing for aesthetics rather than execution reality.
Market mapping and contract equivalence
Cross-platform comparability depends on correctly matching markets that are genuinely the same bet. In 2026, small wording differences, timezone cutoffs, settlement sources, and conditional clauses can create contracts that look equivalent but aren’t.
A robust aggregator will:
- Show contract definitions side-by-side, including resolution criteria and deadlines.
- Flag non-equivalent matches (e.g., similar titles but different measurement sources or time windows).
- Expose its market-matching logic (manual curation vs automated similarity, and how disputes are handled).
- Track contract changes over time (edits, migrations, replacements) so historical comparisons stay valid.
API transparency, provenance, and auditability
When trust is the main pain point, “just trust our numbers” doesn’t work. The best aggregators treat data provenance as a product feature.
Signals of high transparency:
- Public documentation for endpoints, fields, and update cadence.
- Clear data provenance (what comes from official APIs vs scraping vs third parties).
- Versioned schemas and changelogs so downstream users aren’t surprised by silent breaks.
- Ability to export raw observations (timestamps, venue fields) so you can reproduce the aggregator’s normalized view.
Even if you never call an API, the existence of solid docs and provenance is a strong indicator that the aggregator takes normalization seriously.
Choose your “default view,” then sanity-check the trade
- Start with your primary job: price shopping, research discovery, or execution checks.
- Use MarketsPrediction as your default scanner for cross-platform live odds, trending markets, filters by category/platform, and top-by-volume lists—then shortlist the specific market on the venue you can actually trade.
- Cross-check the platform’s specifics before you act: liquidity/volume, fees, minimum deposit, deposit methods, and payout/settlement mechanics.
- Keep one “backup” tool (native platform explore pages, a research-first feed like Metaculus/Manifold, or RSS/lists) so you’re not blind when an aggregator lags or a market behaves oddly.