
 Best Platforms
 Live Odds








PData Review: Live Cross-Platform Prediction Market Data
This comparison settles whether pdata is enough as a free, cross-platform prediction-market data layer — what it covers and how you access it, freshness and retention trade-offs, cross-venue “24h volume” semantics and unit mismatches, reuse/attribution posture, where other tools win, and a fit-check checklist so you can pick the right feed for scanning, alerts, research, or backtests.
You’re trying to compare prices and activity across prediction markets without opening five tabs and hand-adding numbers that don’t really match. When you get the data layer wrong, you waste time, misread volume, and build dashboards or notebooks that break the moment you change venues.
pdata promises a single, live view across platforms, with multiple ways to pull it into your workflow. This review shows what you actually get in practice, what “fresh” and “history” mean in its design, where cross-venue comparisons quietly go wrong, and when a discovery-first dashboard like MarketsPrediction is the better fit.
pdata, in practice
pdata is a read-only aggregation layer: it pulls public market data from multiple prediction venues and gives you one consistent way to query it. The defining constraint is also the promise—there’s no trading, no user accounts, and no “connect your wallet” flow. You use it to observe markets across venues, not to execute on them.
What it covers
pdata aggregates live prediction-market data across these 8 platforms:
- Polymarket
- Kalshi
- Manifold
- Myriad
- Limitless
- Predict
- Opinion
- Gemini
The practical win is cross-venue scanning and analysis without building (and maintaining) eight separate API integrations.
Ways to access
If pdata is “one dataset,” these are the four ways you actually touch it:
| Surface | Auth | What you get | When to pick |
|---|---|---|---|
| Web UI | None | Cross-venue browsing | Manual scanning |
| JSON REST API | No auth | Endpoints like /api/v1/events | Scripts, notebooks |
| Remote MCP server | None | 14 MCP tools | AI agents, tooling |
| Read-only Postgres | Public credentials | SQL over full dataset | Analytics, joins |
Two terms matter if you’re evaluating the agent path. Model Context Protocol (MCP) is a standard way for AI clients to call external tools and data sources; pdata exposes a remote MCP server at https://api.pdata.world/mcp so agents can query markets without scraping HTML. Streamable HTTP (remote MCP transport) is the mode where your client talks directly to that remote MCP server URL over HTTP, rather than running a local plugin.
A quick fit check: choose pdata if you want free, attribution-friendly data you can query from code (REST), agents (MCP), or SQL (Postgres at pg.pdata.world:6433), and you’re fine staying strictly on the read-only side of the line. If what you need is execution, accounts, or brokerage-style workflows, pdata is explicitly not that—pair it with a trading venue or a UI scanner such as MarketsPrediction instead.
Freshness and retention
pdata is “live” in the monitoring sense, not in the tick-by-tick sense. The ingestion pipeline polls each upstream platform’s API on its own cadence—10–40 minutes depending on the source—so a price move can’t appear in pdata until the next upstream poll lands.
On top of that, pdata writes a market snapshot (a recorded point-in-time capture of a market’s price/probability and cumulative volume, used to build rolling charts and deltas) every 30 minutes. That 30‑minute snapshot cadence is the clock that drives anything computed from the snapshot stream—especially rolling 24‑hour changes and “movers,” which are derived from differences between snapshots.
History is also bounded. pdata explicitly does not carry historical price ticks beyond ~30 days for snapshots, which effectively caps backtests built from the snapshot table to roughly a month of point-in-time records at 30‑minute spacing.
The other retention limit shows up when an event is no longer considered live. Event detail URLs remain stable, but once an event has been closed for more than 10 days it is removed from the live tables; the same URL then returns a tombstone (a non-live object returned for an event URL after it has aged out of live tables, preserving minimal metadata like final outcomes without full live fields) instead of a live object.
Practically: if your workflow needs minute-level alerting, pdata’s 10–40 minute upstream polling and 30‑minute snapshot interval set hard bounds on freshness; and if your workflow needs deep historical reconstruction, the ~30‑day snapshot retention and 10‑day “live” window after close are the constraints you design around. In many teams, that means using pdata for reproducible monitoring and short-horizon research, while relying on a dedicated cross-platform “where’s the best price right now?” surface (e.g., MarketsPrediction’s odds/volume comparison view) for fast scanning before you drill into a single venue.
Cross-venue comparability
pdata makes it easy to pull “the same fields” across venues, but it can’t make those fields mean the same thing everywhere. The two traps are semantics (what a platform calls “24h volume”) and units (what that volume is measured in).
On first read, “volume” looks like one universal number. In practice you’re usually looking at notional volume—a platform-reported dollar-equivalent trading volume measure that may not be comparable across venues unless you know how each venue defines and reports it. And even if the label is identical, you still need unit normalization—converting volumes/liquidity into a common unit so cross-venue totals are mathematically meaningful; pdata explicitly notes it does not normalize across all sources.
24h volume meaning
For 7 of pdata’s 8 sources, the “24h volume” number is simply whatever the upstream platform reports as its 24-hour notional volume. Limitless is the exception: it doesn’t provide a 24h field, so pdata recomputes a rolling 24-hour figure from snapshots using a specific formula: over the trailing 24 hours, sum up max(0, Δvolume) for each step.
That sounds close enough—until you rank markets across venues. One market’s 24h number might be a venue-native, platform-defined metric, while another’s is a reconstruction that only counts positive increments between snapshots. Put those in a single leaderboard and you’re not just comparing activity; you’re also comparing measurement rules.
That distinction (and pdata’s recomputation rule) is documented in its volume handling methodology.
Units can break totals
The cleanest example is Manifold. Manifold reports play-money mana (M$), and pdata renders Manifold volume in mana; for “currency reasons,” Manifold is also excluded from pdata’s homepage USD volume stack chart.
If you want to stay safe when reading cross-platform totals and “top by volume” rankings:
- Treat Manifold volume as mana-denominated activity, not USD activity.
- Don’t add mana volume into USD-denominated cross-venue totals.
- Compare USD volumes across venues that report in USD-equivalent terms; compare Manifold within Manifold.
- If you need a single, combined number, you have to define your own conversion/valuation layer—pdata is intentionally not doing that normalization for you.
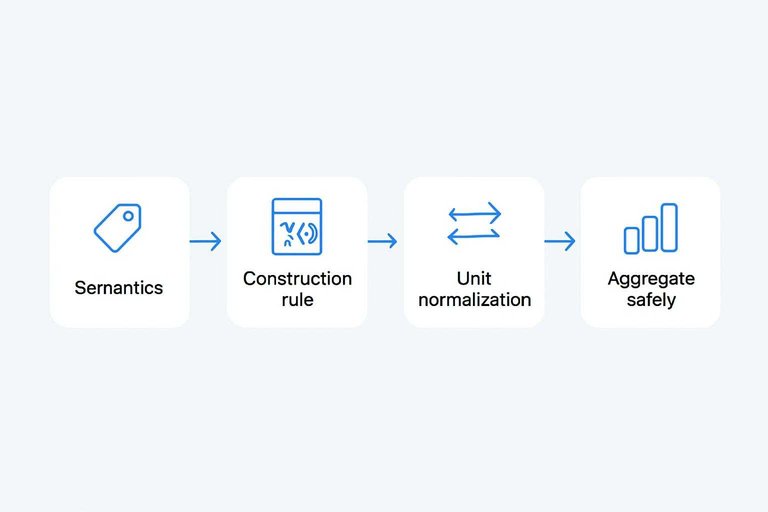
If you can’t state the unit and the construction rule of a volume figure, you can’t responsibly aggregate it.
Reuse and attribution
pdata is explicitly positioned as reusable data, not a “view-only” dashboard. Its dataset is presented under CC BY 4.0 (Creative Commons Attribution 4.0), which means you can reuse and redistribute the data—even inside commercial work—so long as you provide attribution. That posture is what makes pdata plausibly safe to wire into research reports, internal dashboards, or downstream data products without negotiating bespoke redistribution rights (see https://pdata.world/data" rel=“nofollow”).
Attribution is also designed to be automatable. Event detail URLs are stable, so a chart, memo, or model output can cite a persistent link to the underlying event rather than a brittle query. And single-resource responses include a _meta.cite_as field (a ready-to-paste citation string), which is exactly what you want when you’re generating lots of figures and need consistent, low-friction source lines.
This contrasts sharply with providers whose terms are written to prevent you from becoming a competing feed. Oddpool’s Terms of Service prohibit reselling/redistributing its data and prohibit incorporating it into a competing product, data feed, or commercial API. That’s the line that gets crossed when you move from “analysis” to “distribution.” In practice, CC BY‑style posture is what enables the ecosystem of lightweight aggregation and discovery layers people actually use day to day—whether that’s an internal comparison dashboard or a public-facing scanner like MarketsPrediction—because the legal surface area is clearer and attribution can be baked into the output.
Where others win
pdata’s strongest role is as a public, read-only aggregation layer you can query immediately; that’s ideal for broad discovery pulls and reproducible analysis across venues. The flip side is that it’s not a keyed, quota-managed feed, and it’s not a purpose-built UI for rapid, human scanning—so the “best tool” depends less on feature checklists and more on which part of the workflow you’re trying to cover.
| Option | Best workflow fit | Where it loses (real limitation) | Pair it with |
|---|---|---|---|
| pdata (free, public surfaces) | Scripts, notebooks, agents | Public endpoints; no auth/rate cards | A UI scanner for fast triage |
| UI scanner (e.g., MarketsPrediction) | Human scanning, “what’s moving” | Coverage can be “Top 30”-style views | pdata for data pulls + citations |
| Paid API (e.g., Oddpool) | Keyed access, quota-managed requests | Free plan: 1,000 req/month; no longer accepting new subscriptions | pdata for broad discovery |
| Analytics dashboard (e.g., Resolve Markets) | Upload a dataset; analyze trades | 50 MB max upload | pdata/Postgres export upstream |
If you’re building a stack, the clean split is: use pdata for reproducible queries, then add a scanner for speed or a paid feed for keyed access patterns—and keep dashboards as the “last mile” for analysis, not ingestion.
Fit check checklist
Use this as a go/no-go before you build anything.
- pdata alone is sufficient if you’re fine with a public, read-only feed (no trading, no accounts) and your work is discovery, research, or monitoring from code.
- pdata breaks if you need a contractual/keyed data relationship: its endpoints are public with no auth and no rate cards, so you’re not buying quotas or SLAs.
- Choose REST when you want simple scripted pulls and a stable spec surface (it publishes an OpenAPI 3.1.0 description).
- Choose MCP when your “client” is an AI toolchain: pdata exposes an MCP server with 14 tools, supports remote MCP over Streamable HTTP, and even documents specific MCP spec revisions.
- Choose Postgres when you need SQL joins over the full dataset; pdata publishes a public password it says it will never rotate.
If you need keyed quotas anyway, Oddpool’s pricing lists 1,000 requests/month on Free—but it also says it’s no longer accepting new subscriptions; for fast human triage, use MarketsPrediction alongside pdata.
Pick pdata for the data layer
If your goal is to stop rebuilding eight integrations and get attribution-friendly, reusable market data into notebooks, SQL, or agent tooling, pdata earns its keep as a free, read-only aggregation layer (https://pdata.world/data" rel=“nofollow”). Just design around what it is: polling-based “live” (10–40 minute upstream cadence), 30‑minute snapshots, ~30‑day snapshot retention, and tombstoned event objects after 10 days closed—plus volume numbers that don’t become comparable unless you respect their units and construction rules (especially mana vs USD and venue-defined vs snapshot-derived 24h volume). When what you actually need is fast human triage—what’s moving, where the best price is right now—use a discovery-first scanner like MarketsPrediction, then drill into pdata for reproducible pulls and clean citations. And if you require keyed quotas or a contractual data relationship, pdata isn’t trying to be that; reach for a paid API for that access pattern and keep pdata as the broad, no-friction discovery backbone.
Frequently Asked Questions
- Which prediction market platforms does PData cover for live cross-platform prediction market data?
- PData aggregates public market data across 8 venues: Polymarket, Kalshi, Manifold, Myriad, Limitless, Predict, Opinion, and Gemini.
- Can I use PData to place trades or connect an account or wallet?
- No—PData is read-only and doesn’t support trading, user accounts, or any “connect your wallet” flow.
- How far back does PData’s historical data go for backtesting prediction market prices?
- PData doesn’t carry historical price ticks beyond ~30 days for snapshots, so snapshot-based backtests are limited to about a month of point-in-time records.
- Is PData the same thing as a prediction market scanner like MarketsPrediction?
- Not quite—PData is a queryable aggregation layer for pulling data into scripts, agents, or SQL, while a scanner is built for fast human browsing and cross-platform odds comparison.
- If I need the best price right now across platforms, should I rely on PData or a live odds comparison site?
- Use a live odds comparison site for rapid “where’s the best price right now?” scanning, then use PData to pull the underlying event data for analysis and citations; MarketsPrediction is designed for the scanning step.