
 Best Platforms
 Live Odds








How to Track Live Prediction Market Odds: A 7-Tool Setup
A practical guide to tracking live prediction market odds with a 7-tool setup—define the odds you’ll monitor, choose capture vs API access, automate collection with a scheduler, normalize and deduplicate data, and store it reliably for analysis.
Trying to track prediction market odds “live” sounds simple—until the page layout changes, an API rate-limits you, or your timestamps don’t line up across sources. Then your chart stops making sense, and you’re left guessing what actually moved.
This guide walks you through a dependable 7-tool stack: browser capture for UI-only markets, an API client where available, scheduling and secret handling, and a transformer that normalizes, deduplicates, and enriches every snapshot before it hits storage.
Pick Your Data Stack
Live odds only matter if you define “live” for your use case. Your stack should match your refresh needs, fields, and risk tolerance.
Define odds targets
You need a precise target before you collect anything. Otherwise, you’ll store noise and miss the moves that matter.
Decide these targets up front:
- Markets and contracts you track
- Refresh rate per market
- Fields: price, spread, volume
- Timestamp and timezone
- Market status: open, paused, resolved
Treat this like a schema contract, not a wish list.
Choose source access
Your access method determines reliability, legality, and maintenance work. Pick the least fragile option that still meets your refresh needs.
| Source method | Pros | Constraints | Ops overhead |
|---|---|---|---|
| Official API | Stable, structured | Auth, rate limits | Low to medium |
| Web scraping | Any page works | ToS risk, breakage | High |
| RSS or feeds | Simple, lightweight | Missing fields, lag | Low |
| Community mirrors | Fast to start | Trust, continuity | Medium |
If you can use an API, do it. Scraping is a tax you pay forever.
Name the 7 tools
A clean pipeline needs distinct jobs, not one mega-script. Each tool should fail clearly and restart cleanly.
- Browser capture: record network calls
- API client: fetch odds data
- Scheduler: run jobs repeatedly
- Transformer: normalize and validate
- Storage: keep raw and clean
- Dashboard: chart odds history
- Alerting: notify on triggers
When each piece has one job, debugging stops being detective work.
Architecture sketch
Your flow is simple on paper, then reality hits with timeouts and schema drift. Design for those failures on day one.
Ingest from API or capture, then normalize fields into a consistent schema. Store both raw responses and cleaned rows, then visualize trends and fire alerts from stored data.
Build retries and backoff at ingest, plus validation at transform. Otherwise, your dashboard will look “live” while silently lying.
Tool 1: Browser Capture
When a prediction market has no API, the browser becomes your data source. Playwright gives you repeatable page loads, durable capture, and fewer “works on my machine” surprises.
Install Playwright
You want a clean install that launches real browsers and proves it can reach your target market page.
- Install Playwright for Node or Python.
- Install bundled browsers with the Playwright installer.
- Create a minimal script that opens the market URL.
- Wait for the odds area, then print one captured value.
- Run it twice to confirm repeatability.
If the smoke test is flaky now, it will be unusable under a scheduler later.
Stabilize selectors
Odds UIs change often, and brittle selectors are the fastest way to silent data corruption.
- Prefer stable data attributes over CSS classes.
- Anchor on nearby labels, then traverse to odds.
- Use explicit waits for network and DOM readiness.
- Capture screenshots and HTML on failures.
- Validate format before accepting a value.
Treat selector work like tests, not scraping, and your pipeline will survive redesigns.
Export structured JSON
Captured strings are useless until you normalize them. Convert odds, prices, and outcomes into a consistent JSON record with a timestamp you can trust.
Use fields like:
- “timestamp”: ISO-8601 UTC string
- “source”: site identifier
- “market_id”: stable slug or URL hash
- “market_url”: canonical URL
- “contract”: outcome name
- “price”: normalized numeric string
- “currency”: implied unit, if any
- “raw_text”: original captured text
Once your JSON schema is stable, storage and analytics become boring. Good.
Schedule-friendly runs
Schedulers need a single command that exits cleanly and fails loudly. Make one entrypoint that runs once, uses headless mode, and returns a non-zero code on errors.
- Add a CLI command that accepts URL and output path.
- Default to headless mode, with a debug toggle.
- Set navigation, selector, and overall timeouts.
- Write JSON to stdout or an atomic file.
- Exit 0 on success, 1 on capture failure.
Predictable runs make monitoring easy, and monitoring is what keeps you honest.
Tool 2: API Client
Official APIs are your cleanest path to live odds. You get stable fields, fewer breakages, and less guesswork.
Use Python Requests as the transport layer. Add pagination, backoff, and consistent parsing so your pipeline stays boring and reliable.
Auth and headers
Auth failures look like flaky networking. They are usually bad headers, missing tokens, or leaked secrets.
- Store keys in a
.envfile, never in code. - Load variables with
python-dotenvat process start. - Set
AuthorizationandAcceptheaders consistently. - Add a descriptive
User-Agentand contact email if allowed. - Centralize headers in one
requests.Session().
If your headers differ per call, debugging becomes archaeology.
Handle rate limits
Markets move fast, and APIs protect themselves. Your job is to be predictable under pressure.
- Retry with exponential backoff and jitter
- Cache recent responses by URL
- Send conditional requests with ETag
- Log 429s with rate headers
- Cap concurrency per host
Treat 429s as coordination signals, not errors.
Unify output format
Scraping and APIs should produce the same object. That keeps storage, alerting, and charts unchanged.
Create a small mapper that converts API fields into your canonical JSON. Keep it strict on required keys, loose on extras.
Once the schema is stable, swapping data sources stops being a rewrite.
Tool 3: Scheduler
A scheduler keeps your collectors running when you are not watching. You want predictable cadence, durable logs, and enough uptime for the markets you track.
Pick a scheduler
Choose one scheduler first, then standardize how every collector runs and logs.
| Option | Uptime | Secrets | Cadence limits |
|---|---|---|---|
| GitHub Actions cron | Good | Built-in secrets | Minutes, not seconds |
| VPS cron | Depends on host | Env vars, vault | Any interval |
| systemd timers | High on server | Env vars, vault | Flexible |
| managed scheduler | High | Built-in secrets | Depends on vendor |
If you need sub-minute polling, Actions is the wrong tool.
Create a cron job
Use cron when you control a server and want simple, boring reliability.
- Set the server timezone to match your reporting needs.
- Create a cron entry that runs your collector on a fixed interval.
- Pipe stdout and stderr to a log file per collector.
- Rotate logs with logrotate to cap disk usage.
- Add a lightweight health check that alerts on repeated failures.
A scheduler without log rotation is a slow disk-filling bug.
Protect secrets
Your collectors will need API keys, session tokens, or webhooks. Treat those as production credentials even if the project is small.
Store tokens in GitHub Actions Secrets or server environment variables. Never commit a .env file, and use least-privilege keys scoped to read-only access when possible.
If a key leaks once, assume it will leak again unless you fix the workflow.
Tool 4: Data Transformer
You need a thin transform layer before storage, or your database becomes the cleaning crew. A lightweight Python step keeps raw pulls usable, comparable, and replayable when feeds glitch or formats drift.
Normalize timestamps
Mixed timezones and ambiguous formats will corrupt every chart and alert you build. Normalize early, then keep both “when you saw it” and “when they said it happened.”
- Parse incoming timestamps and detect missing timezone offsets.
- Convert all times to UTC and store as timezone-aware datetimes.
- Add collection_time (your fetch time) and exchange_time (their event time).
- Serialize to ISO 8601 with seconds and a Z suffix.
- Reject or quarantine rows with unparseable times.
Once UTC is the default, “weird spikes” become debuggable instead of mystical.
Compute derived fields
Raw odds are hard to compare across venues and contract types. Derived fields make every downstream query simpler.
- Compute implied_probability from price or odds.
- Compute mid_price from best bid and ask.
- Compute tick_change from prior stored tick.
- Flag stale when exchange_time stops moving.
- Flag suspended when market is paused.
Do the math once, close to the source, and every dashboard stays consistent.
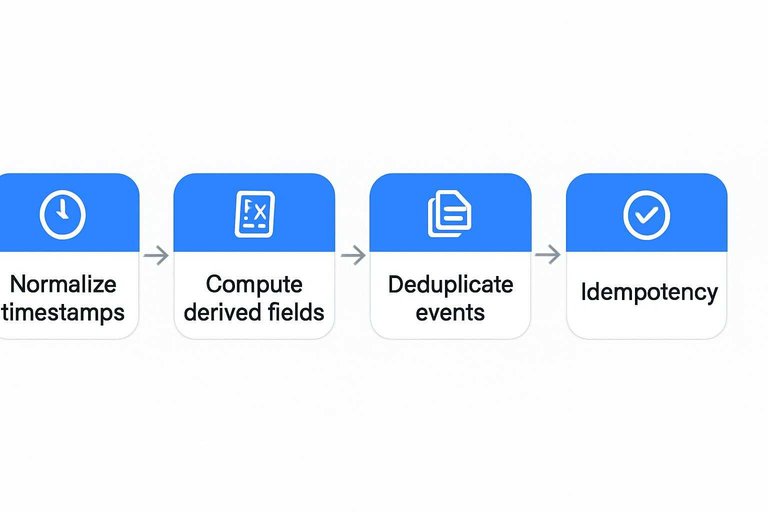
Deduplicate events
Retries and parallel workers will double-write unless you plan for it. Deduplicate at the transformer so storage can stay append-friendly.
Use a deterministic key like (venue, market_id, exchange_time) plus a small timestamp bucket for noisy feeds. If exchange_time is missing or unstable, hash a canonical JSON payload after sorting keys and normalizing floats.
The goal is idempotency: run it twice, store it once.
Tool 5: Storage Layer
You need a place to store odds snapshots so you can chart them, backtest them, and debug your collectors. Start simple with SQLite, then move to Postgres when concurrency and retention start to hurt.
A time-series-friendly schema beats a fancy database every time.
| Need | SQLite | Postgres | When to choose |
|---|---|---|---|
| First prototype | Single file | Managed instance | You want zero ops |
| Write throughput | Fine for 1 writer | Many writers | Collecting many markets |
| Query speed | Good indexes | Better planner | You run many dashboards |
| Retention growth | File grows | Partitioning options | History gets heavy |
| Integrations | Local scripts | BI and services | More teams use data |
Upgrade when you’re fighting locks and slow queries, not when you’re bored.
Tool 6: Data Quality & Drift Checks
“Live prediction market odds” are only useful if they’re trustworthy. Without data quality checks, you’ll alert on UI glitches, chart stale markets as “flat,” and mistake partial updates for real moves.
Your goal isn’t perfection—it’s fast detection of bad data, plus a paper trail that lets you replay and explain what happened.
Define freshness and staleness
A market can be open but effectively dead. Track staleness explicitly so “no movement” doesn’t masquerade as signal.
- Compute
age_seconds = collection_time - exchange_time(or usecollection_timeonly if the venue provides no event time). - Set a per-market staleness threshold based on how often that venue normally updates.
- Emit
stale=truewhen age exceeds the threshold. - Distinguish between
paused/suspended(venue status) andstale(your observation).
If you can’t define freshness, you can’t claim live.
Catch outliers and format drift
Breakages rarely fail loudly. More often, you get a “valid” number that’s wrong.
Add lightweight validation rules in the transformer stage:
- Price bounds: reject values outside expected ranges for your contract type.
- Jump checks: flag sudden changes that exceed a sane tick jump for the market.
- Type checks: ensure numbers parse cleanly and aren’t empty strings, NaN, or locale-formatted surprises.
- Enum checks: validate market status fields and contract names against known values.
When a rule triggers, quarantine the row (store it, but don’t chart/alert from it) and keep the raw payload for inspection.
Detect gaps and partial updates
Many sources update different fields at different times. A “live” snapshot can be half old and half new.
- Track missing fields per record and count them over time.
- Flag “partial” snapshots when key fields are absent (e.g., price present but volume/spread missing).
- Detect ingest gaps by checking time between snapshots per (venue, market_id, contract).
- Log collector failures separately from “no update” periods so you don’t misread downtime as stability.
Gaps matter because your charts will interpolate silence into stories.
Add an audit trail (minimal but real)
When something looks wrong, you need to answer: what did we fetch, from where, and under what code/config? For a practical example of applying these checks to a single election market, see how to track Michigan primary odds.
Store these alongside each raw response or batch:
- collector version (git commit or image tag)
- source URL / endpoint and query params
- response hash (or raw body if size is manageable)
- HTTP status, latency, and retry count
- parser/transformer errors with stack traces
Auditable pipelines make debugging fast—and make your alerts defensible.
Build the Minimal Loop, Then Harden It
- Start with one market and one source: define the exact odds targets (contract, side, price/odds field) and decide whether you’ll pull via API or browser capture.
- Make the output consistent: emit a single JSON schema from both Playwright and the API client, then run it through the transformer to normalize timestamps, compute derived fields, and deduplicate.
- Automate safely: schedule runs with cron (or your scheduler of choice), keep secrets in environment variables or a secret manager, and log failures with enough context to replay.
- Only then expand: add more markets and higher frequency after you’ve verified selector stability, rate-limit handling, and that storage queries return the same numbers you see live.
Frequently Asked Questions
- Are live prediction market odds the same as the “last traded price” on a market like Polymarket or Kalshi?
- Not always. “Live odds” usually means the most recent actionable quote or price for a contract, while “last traded price” can lag if trading is inactive or if spreads widen.
- How do I measure whether my live prediction market odds feed is accurate and not missing updates?
- Cross-check a sample window against the market UI or official API by comparing timestamps, contract IDs, and price changes, then monitor for gaps, out-of-order events, or repeated values that indicate dropped or cached responses.
- Can I track live prediction market odds across multiple markets and normalize them into one “implied probability” field?
- Yes. Convert each venue’s quote format into a consistent implied probability (0–1) using the contract’s payout rules, then store the original raw fields alongside the normalized value for auditing.
- What if a prediction market blocks scraping—how can I still track live prediction market odds reliably?
- Use official APIs where available, and when they aren’t, prefer permitted data sources (market-provided feeds, partners, or exported data) rather than escalating scraping tactics that violate terms or trigger bans.
- How often should I poll live prediction market odds, and when should I switch to a streaming approach?
- Poll frequently enough to capture meaningful price moves without triggering rate limits, and switch to streaming/websocket-style updates when the market offers them or when polling starts missing short-lived changes.