
 Best Platforms
 Live Odds








Prediction Market Analytics Dashboards for Cross‑Venue Trading (2026)
2026 picks (including MarketsPrediction) and a 20‑minute checklist to vet cross‑venue equivalence, freshness, depth/fees, exports, and data rights.
You’re trying to track fast-moving bets on real-world outcomes across multiple apps and websites, and you want one screen that tells you where the action is and what price is really available. The obvious move—sorting by “best odds” or “highest volume”—breaks down the moment two similar-looking markets don’t actually settle the same way, or when liquidity and fees change what you can execute.
This collection gives you a practical map of dashboard types for 2026, then a short list of picks and a falsifiable checklist to test any tool’s freshness, cross-venue matching (same outcome, same rules), exports/APIs, and data-rights constraints before you trust it.
Equivalence before arbitrage
Before you treat a cross-venue price gap as “arbitrage,” ask a boring question: are you comparing the same contract, or two different contracts that share a headline? Many scanners assume “looks similar” is enough; similar-looking markets can resolve differently, turning an apparent gap into a fake edge.
First non-negotiable: polarity—whether “YES” corresponds to the same real-world outcome on both venues. Dashboards get this wrong when one venue’s contract is implicitly the negation (“YES = will NOT happen”), or when the UI labels the opposite side more prominently. If the tool doesn’t explicitly flip one side, your “cheap YES” might actually be expensive.
Second non-negotiable: resolution criteria—the exact rule text that decides settlement (source, cutoff time, and void/refund edge cases). Two markets can share a title yet differ on when the outcome is measured, which authority is final, or what happens if data is missing.
Then comes timing. A gap can be nothing but mismatch in update cadence: even a dashboard that shows “Last updated” can be pairing a fresh venue with a stale one, or mixing streaming feeds with batch-refreshed ones. If a dashboard can’t prove polarity + resolution + timing alignment, use it for single-venue monitoring—not cross-venue decisions.
Volume comparability traps
“Top by volume” is a great way to find what people are trading, but it’s a bad way to compare venues. MarketsPrediction, for example, surfaces “Top Markets By Volume” with per-platform “Top 30” shortcuts—useful for discovery, dangerous as a cross-venue scorecard.
The trap is that “volume” isn’t a single comparable unit across mechanisms. A dashboard that merges 24h volume across platforms without stating its methodology is mixing behaviors, not ranking markets.
Then there’s execution: a quoted YES price is only real if you can actually buy size near that level. Order book depth—how much liquidity is available at each price level—tells you your slippage and whether the apparent edge survives your trade size. If a dashboard shows odds without depth (or depth without fees), “best price” becomes a paper trade.
Dashboard types 2026
Pick the smallest dashboard class that matches your workflow; everything else is expensive clutter—especially if your main need is simply scanning what’s active and comparing venue-specific prices quickly.
First-use glosses: WebSocket means live streaming updates (not periodic refresh). MCP is a standard way for coding agents to query structured data; a read-only Postgres connection lets you run SQL without managing user auth.
| Tool class | Workflow it fits | What you should demand | Concrete telltale example |
|---|---|---|---|
| Discovery / screener | Find what’s active fast | Strong filters + trending views + per-platform market stats | MarketsPrediction “Top Markets By Volume” + per-venue “Top 30” shortcuts |
| Cross-venue comparison | Price-shop the same idea | Per-venue breakdowns, not a single blended number | Polyanalytics Pro positions “Kalshi arbitrage” alongside alerts/export |
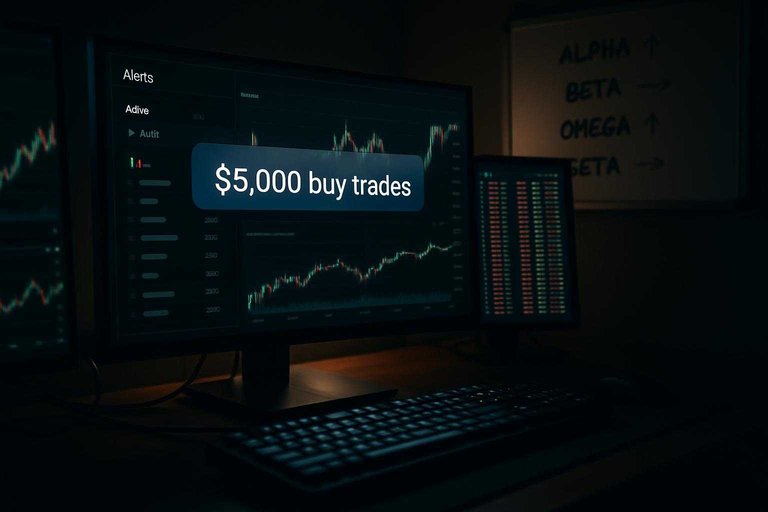
| Whale intel / alerts | Follow big flows in real time | Thresholds + timestamped alerts | PolyInsider flags buy trades above $5,000 via Polymarket WebSocket |
| Portfolio / trade-history analysis | Review your own fills | Import your history + privacy controls | Resolve Markets supports Kalshi/PredictIt CSV; dropping “contracts” boosts privacy |
| Research / API layer | Build models/internal dashboards | Queryable access + clear retention limits | pdata offers REST + MCP + read-only Postgres; ~30 days of snapshots |
MarketsPrediction scanner pick
If your job is discovery/screening—finding what’s moving across venues before you decide where to dig—MarketsPrediction is built like a fast “front page” for prediction markets. The tell is that it surfaces cross-platform activity with a visible freshness check: the homepage includes a “Live Data” timestamp (for example, “Last updated: September 4, 2026 at 1:52 AM UTC”).
Where it extends beyond a simple list is cross-venue comparison. You can see the same event broken out by platform, plus platform-level rollups that act as a quick reality check on where activity is concentrating—MarketsPrediction currently shows $5.4B Weekly Notional Volume, 12.5M Active Markets, and 113.3M Weekly Transactions. For a side-by-side evaluation against a more execution- and wallet-analytics-oriented tool, see MarketsPrediction vs IYKYK Markets comparison. That’s enough to price-shop and decide which venue deserves your next click.
It’s not trying to be the other three workflow classes. There’s no wallet-level alerting interface here (whale intel), no import-and-review of your own trade history (portfolio analysis), and no programmatic access layer for models and internal dashboards (API research). Use it to narrow the field fast, then switch tools once your work becomes execution-, account-, or data-pipeline-driven.
Other dashboard picks
If you already have a screener and a cross-venue view, the next decision is which workflow you’re actually paying for: wallet intel/alerts, portfolio & trade-history review, or a programmatic data layer.
When you’re comparing data-layer products, ask what market data granularity you get: a WebSocket feed (a streaming connection for live updates, not periodic polling), OHLCV candles (open/high/low/close/volume per time bucket for charting and backtests), or tick-level trades (every individual fill event for microstructure and execution simulation).
| Job-to-be-done | Pick | Pricing cue | Concrete limits | Where it wins |
|---|---|---|---|---|
| Programmatic research / API | Oddpool | Free tier available | 1,000 requests/month (Free); no data resale/competing API | Simple, metered API access |
| Programmatic research / data layer | pdata | Pricing not stated | ~30 days snapshots; no user accounts | REST + MCP + Postgres query |
| Portfolio / trade-history analysis | Resolve Markets | Pricing not stated | 50MB max file; Kalshi + PredictIt CSV | Private, local history review |
| Wallet intel / whale flow | WhaleScoop | Free data delayed | 7-day delay; ~3 min refresh | Lightweight flow monitoring |
If you can’t name your job-to-be-done in one line, you’ll default into overbuying a “dashboard” when what you needed was one narrow feed or import tool.
Verification checklist (test-drive in 20 minutes)
Run these checks on 2–3 dashboards (including discovery/aggregation views) before you trust any cross-venue “edge.”
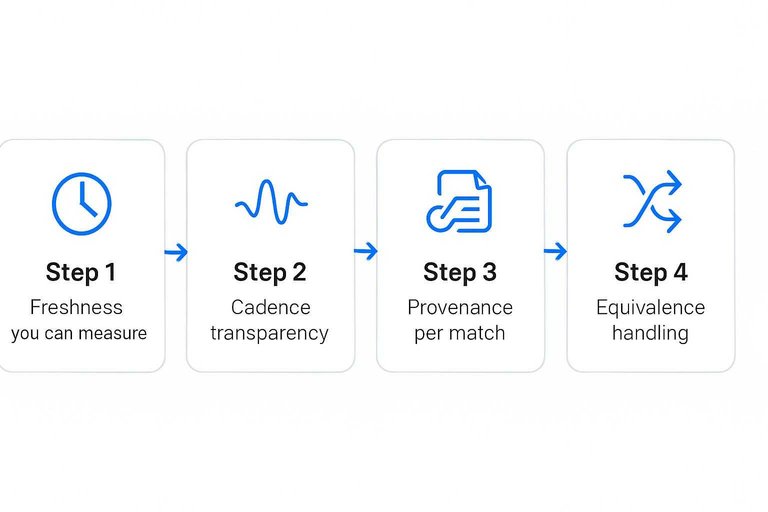
- Freshness you can measure. Find a per-venue “last updated” (not just a homepage timestamp). If a vendor claims specific latency, verify it by watching a fast-moving market; Resolve Markets advertises live WebSocket data with “<100ms Update latency.”
- Cadence transparency. The product should say whether it streams updates or refreshes in batches, and it should show when a feed is paused or degraded.
- Provenance per match. Every matched contract needs direct links back to the venue’s contract page and the exact resolution-rule text used to settle.
- Equivalence handling. Try an edge case: opposite polarity, different cutoff time, or different void/refund rules. The dashboard should flip, split, or refuse the match—and tell you which.
- Historical depth. Confirm you can pull enough history for your workflow, and that retention is stated (ticks vs snapshots).
- Export/API + “when unsure.” Export a slice and check it preserves venue IDs, contract IDs, timestamps, and resolution/provenance. If the tool can’t map a market, it should label “unknown” and stop—no blended odds. (This matters even for scanners like MarketsPrediction when you use them to shortlist markets for deeper analysis.)
Rights and integration
Oddpool’s Terms explicitly prohibit data resale and using its data in a competing product, data feed, or commercial API—so a “public dashboard” or republished newsletter feed can be a non-starter even if the UI is great. Even lighter-weight promo/affiliate surfaces can carry compliance strings: MarketsPrediction’s promo offers show eligibility language requiring users to be 18+ with a legal U.S. residential address.
Security is another quiet deal-breaker. Resolve Markets claims “API keys never leave your browser” and uses 256-bit AES encryption; pdata says it doesn’t store user accounts and “doesn’t trade,” which matters in vendor-risk reviews.
Then pick an integration surface you can live with: REST, SQL (via PostgreSQL), or MCP—Model Context Protocol, a standard way for tools to expose structured data/actions to AI coding agents. pdata is a read-only aggregator across 8 platforms (Polymarket, Kalshi, Manifold, Myriad, Limitless, Predict, Opinion, Gemini) and exposes REST + MCP + a read-only Postgres connection with “No auth.” If rights, keys, or retention don’t fit, eliminate the tool early.
Decision rubric (pick by intent)
Use the row that matches what you’re doing today, then eliminate anything that fails a must-pass check.
| Intent | Best-fit tool profile (examples) | Must-pass checks | Nice-to-haves |
|---|---|---|---|
| Sports odds shopping | Fast cross-venue screener (MarketsPrediction) | Per-venue odds + timestamps; direct contract links; depth/fees context | Tight filters; platform stats; promo hub (offers show 18+ + US-address eligibility) |
| Politics tracking | Comparison view that proves equivalence | Polarity + resolution-rule visibility; “can’t match” labeling; per-venue last-updated | Category views; shareable market links; lightweight watchlists |
| Quant research | Data layer / API product (pdata; Oddpool API) | Programmatic access (REST/MCP/SQL); rate limits stated; retention stated | pdata: read-only Postgres “no auth,” 8-platform aggregator; Oddpool: 750+ event dashboards (Free) |
| Newsroom monitoring | Live monitor + export workflow (Resolve Markets) | Live feed with latency claims (<100ms); provenance links; key-handling model | 90,000+ contracts coverage; CSV trade analysis (Kalshi/PredictIt), 50MB max; privacy option to delete “contracts” column |
If a tool fails any must-pass item for your row, treat it as a discovery screen—not something you base cross-venue decisions on.
Verify equivalence, then pick tools
If you want “one screen” for fast-moving markets, the make-or-break isn’t a prettier odds table—it’s whether the dashboard can prove you’re comparing the same contract (polarity + resolution criteria) on the same clock, and whether the price is executable once depth and fees are considered. Use MarketsPrediction as the front page to spot what’s active and price-shop by venue, then graduate to a workflow-specific tool when you need alerts, portfolio review, or a programmatic data layer. Your first move is simple: run the 20‑minute verification checklist on 2–3 candidates; any tool that can’t show per-venue freshness and provenance—or won’t say “unknown” when it can’t match—belongs in discovery only, not cross-venue decisions.
Frequently Asked Questions
- Are whale alerts on prediction market dashboards a tradable signal by themselves in 2026?
- No—treat whale alerts as context, not a standalone entry signal; verify the entry price, whether the position is new vs. legacy, and the market’s depth/fees before acting on a large-trade ping.
- Is a high win-rate or realized P&L leaderboard the same thing as “smart money” you should follow?
- Not quite—leaderboards can be biased if the dataset doesn’t reconstruct positions against final resolutions, so use them as a lead generator and then validate the wallet’s actual entries, exits, and settlement outcomes market-by-market.
- What’s the quickest way to test whether an API-based prediction market dashboard is viable for cross‑venue trading?
- Start by checking the plan’s hard limits (requests and WebSocket caps) and whether the license allows your intended use; Oddpool publishes monthly request quotas plus WebSocket connection/event limits on its pricing page.
- How do I import my own trades for portfolio analysis, and what privacy tradeoffs should I expect?
- Use a dashboard that accepts your venue export and states its constraints; Resolve Markets supports Kalshi and PredictIt CSV uploads with a 50MB max file size, and deleting the “contracts” column improves privacy but removes some charting features.
- Do I need a full analytics suite, or can a screener-style site handle cross‑venue price shopping?
- If your goal is fast discovery and quick per‑venue odds comparison, a screener is enough; MarketsPrediction is built for scanning trending events and comparing platform-by-platform prices before you switch to an execution or data-layer tool.