
 Best Platforms
 Live Odds









9 Betting Market Metrics Worth Evaluating in 2026
2026 checklist of 9 betting market metrics: spread, depth, fees, volume vs OI, and time to finality for tradability and settlement risk.
You’ve found a market with a great-looking price, but you still don’t know if you can actually trade it. If you screen by the headline odds and a big 24‑hour volume number, you can end up paying hidden costs, moving the market against yourself, or getting stuck in a position you can’t unwind.
This case study gives you a defensible, platform-aware checklist of nine metrics to evaluate before you commit capital—covering quoted tradability (bid–ask spread, midpoint, order book depth), activity (open interest vs volume), all-in costs (maker/taker fees, tick size, minimum order size), and finality (resolution rules, time to settlement, and Brier Score for post-mortems).
Define performance
Execution vs exposure
In betting markets, “performance” isn’t the prettiest displayed percentage—it’s what it cost you to get filled, whether you can get back out at your intended size, and how long your capital is trapped until the outcome is final. Execution cost is the gap between the screen and your realized price once you include slippage (the extra price you pay when your order consumes thin liquidity) and explicit fees. Even basic mechanics can change what the screen “means”: Kalshi publishes a bid-only order book, where asks are implied (a YES bid at X is equivalent to a NO ask at 1.00−X), so you can’t evaluate tradability from a single quote without reconstructing the other side of the market.
Fees are also shape-shifters, not a single “commission %.” Kalshi’s schedule uses a p×(1−p) term with coefficients like 0.07 for taker trades, and Polymarket’s fee model applies a similar p×(1−p) structure while charging makers zero on markets where fees apply.
SERP myths, answered
Prediction markets trade contracts that settle on real-world outcomes; people use them for speculation, hedging, and forecasting, which is why “gambling” misses the execution-and-risk question you actually have to manage. Polymarket is not “just crypto” or “just sports”: its fee schedule is explicitly category-based and includes Politics (0.04 taker fee rate), so you should expect very different microstructure by category.
Whether a famous trading firm is involved in sports betting is trivia for this checklist; you can’t trade a rumor, but you can measure an order book. And the size of the U.S. sports betting industry is a terrible proxy for tradability—your bottleneck is the market in front of you: sometimes the “last trade” isn’t even a trade (Polymarket can return a 0.5 placeholder when a token never traded and the book is empty). The fix is to anchor on executable prices from the book—spread/midpoint exist as public endpoints—and then layer in time-to-finality: Polymarket’s undisputed resolution is ~2 hours, but a dispute can extend finality to 4–6 days.
Disagreements that matter
The biggest gaps in practice aren’t about “who has the best odds.” They’re about what you measure when you decide a betting market is actually tradable.
- Shortcut: “High 24h volume = liquid.” Measure instead: volume quality plus executable book conditions; a working paper applying wash-trading detection to Polymarket estimates wash-like patterns peaked at nearly 60% of volume (Dec 2024).
- Shortcut: “Last price tells me where I can trade.” Measure instead: best bid/ask and the size available there. Kalshi’s market endpoint exposes
yes_bid_dollars,yes_ask_dollars, andlast_price_dollars, which lets you ignore a non-executable last print. - Shortcut: “Commission % is my fee model.” Measure instead: the fee formula plus rounding. Kalshi documents balance precision targets of $0.0001 (Direct) vs $0.01 (non-Direct), which can change effective costs when you split trades.
- Shortcut: “I’ll just exit before settlement.” Measure instead: time to finality (when the result is no longer challengeable and funds are released). Polymarket publishes a challenge/dispute timeline, so settlement risk is measurable, not vibes.
Metrics 1–4: Quotes
-
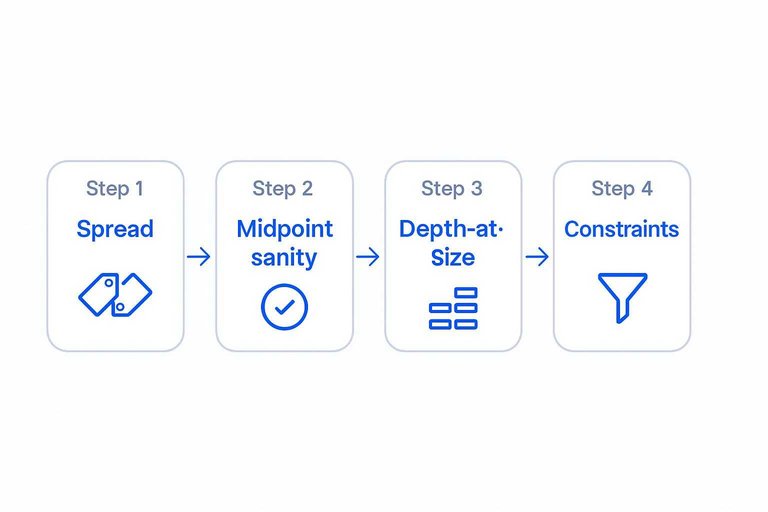
1) Spread (immediate execution cost)
Bid–ask spread—the gap between the best available buy price and best available sell price; a direct proxy for the cost of crossing the market immediately—starts with top-of-book prices. -
Polymarket (CLOB): call
GET https://clob.polymarket.com/book?token_id=...and takespread = best_ask − best_bidfrom the returned asks/bids arrays. -
Kalshi (bid-only book): compute a synthetic ask before you compute spread. With YES/NO as complements, a YES buy is equivalent to selling NO, so
best_yes_ask ≈ 1.00 − best_no_bid, thenspread = best_yes_ask − best_yes_bid. -
2) Midpoint sanity (is the quote internally consistent?)
Midpoint—the average of best bid and best ask; a reference price often used to measure slippage and effective spread—should be computed from a single snapshot. -
Polymarket: the same book response includes a
timestampand a book-statehash; only pair bid/ask from the same response, and comparehashacross reads to know whether the book changed between samples. -
Tick-size check: tick size—the smallest allowed price increment; it controls how finely a market can express probabilities and how tight spreads can get—lets you express spread in ticks:
spread_ticks = (best_ask − best_bid) / tick_size. -
3) Depth-at-size (what can you do without moving the market?)
Order book depth—how much size is resting near the best prices; depth within X cents approximates the slippage you’ll pay at your trade size—is a size-dependent quote. -
Polymarket: from the book’s price/size levels, “walk the book” until you accumulate your target quantity. Compute your expected fill price as a size-weighted average across the consumed levels, then compare to midpoint to estimate slippage.
-
Report it as: depth within Δ (e.g., size available within 1–2 ticks of best) and/or VWAP-to-midpoint for your target size.
-
4) Constraints (when a quote isn’t actually tradable for you)
Constraints turn a pretty quote into a non-starter. -
Polymarket: the same order-book response includes
tick_sizeandmin_order_size(the smallest allowed trade/order size; it can prevent “small” position sizing). The docs’ example showsmin_order_sizecan be"5". -
Your first-pass filter: if your intended size is below
min_order_size, or your required price improvement is smaller thantick_size, treat the displayed quote as non-executable for your plan—before you even get to fees.
Metrics 5–6: Activity
Activity tells you whether a betting market has participants and staying power—not whether you can execute cheaply right now (that’s spread + depth from Metrics 1–4).
-
5) Open interest (capital still “in” the market)
Open interest—the value currently held in outstanding positions (capital still committed), distinct from recent trading volume—answers “is anyone still carrying risk here?” -
How to measure (Polymarket): the Data API exposes open interest at
GET https://data-api.polymarket.com/v2/oi?condition=…, and values are in USDC (a USD-pegged stablecoin). You can request market-level OI by condition ID (the market identifier), or pull a single global figure whenconditionId: null. -
Unit pitfall: “OI” is a stock (what’s outstanding now). Don’t compare it directly to a 24h flow metric without saying “per day.”
-
6) 24h volume (recent turnover)
24h volume is a flow: how much traded in the last 24 hours. It’s useful for spotting current attention, but it’s not automatically tradability. -
Unit pitfall: venues and aggregators may show volume as notional dollars vs contract count; treat it as meaningless until you know the unit.
-
Flag low-quality / incentive-heavy volume (screening red flags)
-
Big 24h volume with flat open interest: lots of churn, little net positioning.
-
Activity spikes that coincide with reward programs: volume can be distorted by incentive-driven or wash-like trading, so don’t use it as a liquidity proxy on its own.
-
Stale aggregates: MarketsPrediction is useful as a cross-platform starting snapshot because it displays per-brand “Volume (24 h)”/“Total Liquidity” alongside a visible “Last updated … UTC” timestamp.
Use volume to find what’s active, and open interest to confirm it has committed capital before you bother reconstructing execution cost from the book.
Metric 7: All-in cost
All-in cost is what your quote really costs once you add the venue’s fee curve and its rounding rules. Compute it as a fee-adjusted effective spread for the same trade size at the same traded probability.
-
Lock the trade scenario and liquidity role
Pick one comparable action (e.g., buy YES now for C contracts at the current book). Decide whether you’re taker (removes liquidity by matching resting orders) or maker (posts a resting order that later gets matched), because the fee schedule can change. -
Price the fill you’ll actually get
From a single order-book snapshot, compute the size-weighted average fill price (VWAP) for C contracts. Keep the snapshot midpoint from the same read so your spread math isn’t mixing states. -
Compute the explicit fee at the traded probability P
Use the venue’s p×(1−p) curve at your P (not “commission %”). On Kalshi (effective July 7, 2026):
- Taker: fees = round up(M × 0.07 × C × P × (1−P))
- Maker (where maker fees apply): fees = round up(M × 0.0175 × C × P × (1−P))
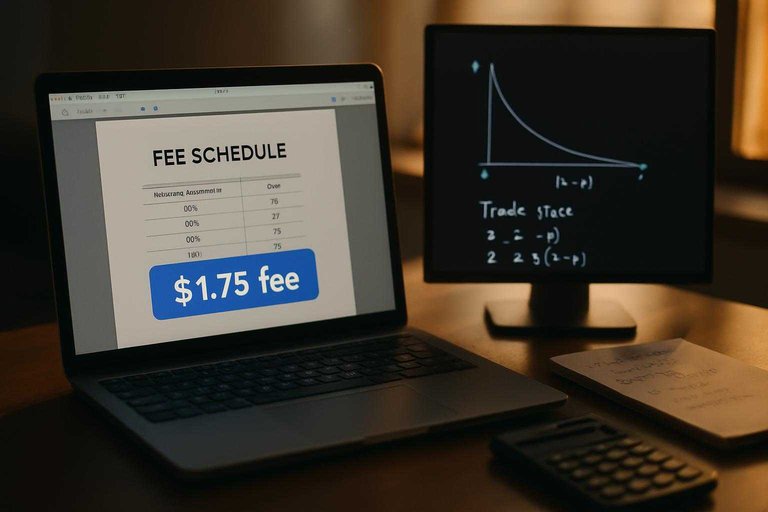
Sanity check: Kalshi’s schedule shows $1.75 fee for 100 contracts at $0.50 (taker), which is exactly where p×(1−p) is largest.
-
Apply rounding/precision rules to the cashflows
Kalshi targets balance precision of $0.0001 (Direct) vs $0.01 (non-Direct), and it can charge a rounding fee to push balance changes back onto that grid. Model fees as “rounded up,” then model balance rounding—especially if you plan to split orders. -
Convert to net prices, then to effective spread
Compute net price per contract:
- Net buy ≈ VWAP + (fees + rounding effects)/C
- Net sell ≈ VWAP − (fees + rounding effects)/C
Then compare venues using the same C and P on a like-for-like net basis.
If two betting markets show the same displayed spread, the one with a steeper p×(1−p) coefficient—or coarser rounding—can still be more expensive to trade.
Metrics 8–9: Finality
Finality is where “I can trade it” turns into “I can get paid.” Treat settlement timing and post-resolution pricing as measurable inputs to ROI, not background noise.
-
8) Time to finality (settlement latency you can price): Time to finality—how long it takes an outcome to become final/settled, including any challenge/dispute windows—isn’t something you can wave away with “I’ll just trade out.” Polymarket publishes the full timeline: an undisputed resolution can be ~2 hours after proposal (a 2-hour challenge period), but if disputed it can extend through a 24–48 hour debate period plus ~48 hours for UMA voting—4–6 days total. Log timestamps for (a) when the outcome becomes knowable, (b) when resolution is proposed, and © when it becomes irreversible and funds are released; those dispute windows are your holding-period risk.
-
9) Post-resolution pricing quality (grade the market after it’s over):
-
CLV: Closing Line Value (CLV)—how your entry odds compare to the final pre-close odds—gets computed as
your_price − closing_price(same side, same timestamp rule). -
Brier Score: Brier Score—a mean-squared-error score for probability forecasts—can be applied to the market-implied probability at close:
(p_close − outcome)^2, then averaged across markets (the U.S. National Weather Service’s standard Brier score is defined as one-half the original score). -
Overround: Overround / book percentage—the amount implied probabilities sum above 100% in a fixed-odds book, representing margin under a balanced book—should be computed from the full outcome set and tracked over time (the excess over 100% is the bookmaker’s profit proportion under a balanced book).
If two betting markets look identical on spread and depth, the one that resolves in ~2 hours when undisputed (instead of carrying a 4–6 day disputed tail) is simply cheaper capital.
Price tradability, not hype
A great-looking percentage and a big 24‑hour volume number don’t tell you whether a market is actually tradable—they’re exactly how you end up paying hidden execution costs, pushing the book against yourself, or locking capital into a long dispute window. Treat “performance” as what you can execute from the order book at your size (spread, midpoint consistency, depth), filtered by hard constraints (tick size and minimum order size), then converted into an all‑in, fee‑adjusted effective spread using the venue’s p×(1−p) curve and rounding rules. Use volume to find attention and open interest to confirm committed risk, but don’t let either substitute for executable prices—especially when last prints can be non-executable. Before you place the first real order, write down one trade scenario (size and maker/taker), compute its net entry and exit costs from a single snapshot, and price in time to finality so you’re not “right” but stuck.
Frequently Asked Questions
- Are prediction markets gambling, or are they financial markets?
- Prediction markets are tradable contracts that settle on real-world outcomes, so the core skill is managing execution costs, liquidity, and settlement/finality risk—not just picking the right side.
- What fees does Polymarket charge in betting markets, and do they change by category?
- Polymarket’s fees are category-based—for example, Sports markets list a 0.05 taker fee rate—so you should check the market’s category before you compare “cheap vs expensive” venues.
- What does “minimum order size” mean in betting markets, and why does it matter?
- Minimum order size is the smallest trade/order a venue allows; if your intended position is below that threshold, the quote you see isn’t executable for your plan and you need to resize or skip the market.
- How do I pull real-time order book data to measure liquidity in betting markets?
- Use Polymarket’s CLOB API for full bids/asks and Kalshi’s trade API for its market data endpoints, then compute spread and depth from the best prices and available size instead of relying on last trade or 24h volume.
- How can I quickly compare which betting markets are active across platforms before I do deep execution math?
- Use a cross-platform scanner like MarketsPrediction to shortlist markets by current activity—its homepage shows site-wide “Weekly Notional Volume” ($5.5B) and “Open Interest” ($124.1B) plus per-platform snapshots—then drill into the specific market’s order book for execution-quality checks.