
 Best Platforms
 Live Odds








11 Implied Probability Calculator Examples Worth Knowing in 2026
A practical collection of implied probability calculator examples for smarter odds reads in 2026—convert moneylines and totals to break-even rates, measure vig across two- and three-way markets, compare parlays vs singles, and pressure-test props and live prices with quick viability checks.
Odds look simple until you try to answer the only question that matters: what win rate do you actually need for this bet to be worth it?
This collection walks you through implied probability calculator examples you can reuse in 2026—moneyline conversions, totals break-even math, two-way and three-way vig, and the hidden traps in parlays, player props, and live betting. You’ll learn what inputs you must have, what still breaks even with “perfect” math, and how to sanity-check prices before you trust them.
2026 Reality Check
Implied probability calculators matter more now because pricing moves fast and formats change mid-scroll. You’re also switching between regulated books, exchanges, and same-game parlays, each with different “gotchas.” A calculator keeps you grounded when your eyes and instincts get rushed.
What changed lately
Odds presentation got more slippery, because apps optimize for speed and promos. You need implied probability to stay consistent when the surface format keeps changing.
Many books now:
- Switch formats in-app (American, decimal, fractional)
- Push boosted lines beside regular lines
- Offer more alt lines with tiny price gaps
- Tighten limits on niche or sharp markets
Treat the calculator like a translation layer, not a prediction engine.
What still breaks
Most mistakes are boring, and they repeat. They happen when you treat the number as truth instead of a price.
- Ignoring vig and calling it “probability”
- Mixing formats across screenshots and markets
- Reading a boost as a better true chance
- Comparing SGP legs to standalone lines
- Assuming implied probability equals real probability
Fix the interpretation first, or you’ll optimize the wrong decision.
When it works best
Calculators shine when you need a fast sanity check, not a full model. They’re great for comparing prices across books or against an exchange snapshot.
Imagine two books showing different formats and a “limited time” boost. Convert both to implied probability, then compare the gap before you even think about narratives.
Use it to catch obvious pricing weirdness, then decide if it’s worth deeper work.
What you must input
Your results are only as clean as your inputs. Get the basics right, then read the outputs like a market quote.
- Odds format and the quoted odds
- Stake or total payout (be consistent)
- Implied probability output
- Margin or hold estimate (vig)
If you can’t state the format and the vig, you don’t have a probability yet.
How to judge viability
Run this checklist before you trust the number.
- Convert odds to implied probability correctly.
- Adjust for vig or estimate the margin.
- Compare the same market type and rules.
- Decide based on value, not certainty.
You’re not trying to be sure. You’re trying to be paid for being right enough.
Example 1: Moneyline Conversion
Moneyline odds look like a price tag, but they hide a probability. You use implied probability to compare markets, not to declare what will happen.
Imagine a matchup priced at -150 for the favorite and +130 for the underdog. Those numbers translate to a market belief, plus built-in margin, not a clean “true chance.”
American to percent
Convert American odds to implied probability when you want one common unit for every book.
- If odds are negative, use: probability = |odds| / (|odds| + 100).
- For -150: 150 / (150 + 100) = 150 / 250 = 0.60.
- Convert to percent: 0.60 = 60% implied probability.
- If odds are positive, use: probability = 100 / (odds + 100).
- For +130: 100 / (130 + 100) = 100 / 230 ≈ 0.4348 = 43.48%.
-150 implies a favorite. +130 implies an underdog. The gap between 60% and 43.48% is the sportsbook’s cushion.
If you want to sanity-check the formulas, this implied probability tool uses the same conversions for American odds. If you want to build your own instead, follow this 7-step spreadsheet calculator setup.
Decimal cross-check
Apps often show decimal while articles show American, and mismatches trigger bad bets. A fast cross-check is converting to decimal, then back to implied probability.
For -150, decimal odds are 1 + (100/150) = 1.6667, and implied probability is 1/1.6667 ≈ 60%. For +130, decimal odds are 1 + (130/100) = 2.30, and implied probability is 1/2.30 ≈ 43.48%.
If your conversions disagree, your inputs are wrong, not the market.
Common misread
Implied probability is easy to misuse because it looks like a forecast. It is a pricing translation.
- Treating implied probability as a prediction.
- Forgetting payouts include your stake.
- Rounding so hard you erase edge.
Use it to compare prices across books, then bring your own estimate of true chance.
Example 2: Totals Break-Even
Totals are often priced at -110 on both sides, so your first job is finding the true break-even rate. Do that, then ask one question: does your estimated win probability clear the vig.
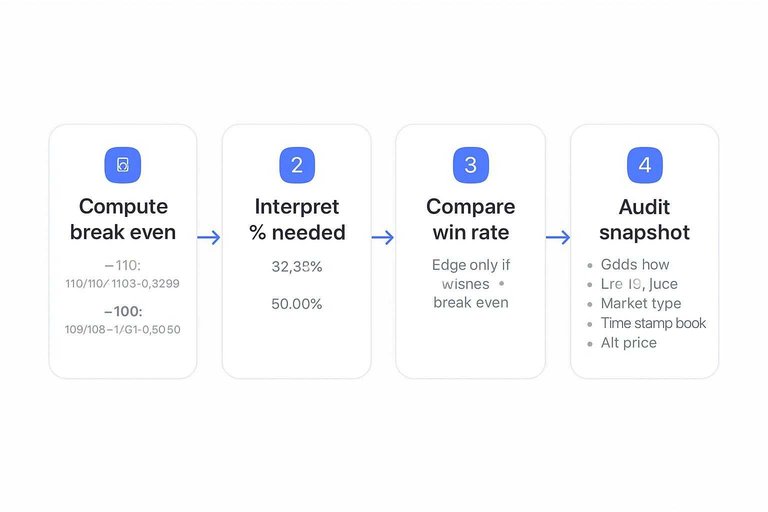
Break-even math
Use the same conversion every time, so you don’t “feel” an edge that isn’t real.
- For -110: break-even = 110 / (110 + 100) = 0.5238.
- Interpret it as 52.38% needed wins to break even.
- For +100: break-even = 100 / (100 + 100) = 0.5000.
- Interpret it as 50.00% needed wins to break even.
- Your “edge” exists only if your win rate exceeds break-even.
At -110, you need to be right more often than you think you do.
Where totals lie
Totals look clean because there are only two sides, but the signal can be noisy. Closing line movement can reflect injury news, weather updates, or limit changes, not just “true” probability.
Totals also hide correlation traps. Pace, efficiency, and game script can move together, so a single input can swing your model and your confidence at once.
Treat implied probability as the price tag, not the truth.
Quick inputs
Your calculator is only as honest as the fields you feed it.
- Odds you can bet now
- Total line and juice
- Market type (full game, half, team total)
- Timestamp and book
- Alternative price you’re comparing
If you can’t recreate the snapshot later, you can’t audit the decision.
Example 3: Two-Way Vig
Two-way markets look simple, but the margin hides inside the prices. Remove it and you get cleaner, no-vig probabilities you can compare across books.
Implied both sides
You want the “true” split between two outcomes, not the book’s padded version. The fix is mechanical: convert, add, then normalize.
- Convert each side’s odds into implied probability.
- Add the two implied probabilities to get the overround.
- Divide each implied probability by the overround.
- Treat the results as your no-vig probabilities.
Once you normalize, your edge comes from price vs probability, not from the book’s tax.
Interpreting hold
That combined total above 100% is the hold, also called overround. It tells you how expensive the market is before you even form an opinion.
In tighter, high-volume markets, the hold is often smaller. In niche markets, alt lines, or smaller books, it’s often larger.
If the hold is big, you need a bigger mistake in the line to have value.
Sanity checks
Before you trust no-vig numbers, check for basic market integrity. Bad inputs create fake “value.”
- Sums below 100% on a two-way market
- Missing an outcome that exists elsewhere
- Stale line versus current market
- Comparing different rule sets
- Odds pulled from different timestamps
Most “edges” die the moment you align rules, timing, and outcomes.
Example 4: Three-Way Markets
Three-way markets add a third outcome, so the “sum to 100%” rule breaks fast. Soccer 1X2 and regulation-time hockey both live here, and the draw changes everything. Get the math right, or you’ll chase fake edges.
Normalize three outcomes
You want apples-to-apples probabilities across Home, Draw, and Away. That requires removing the book’s margin before you compare anything.
- Convert each price to implied probability: p = 1 / decimal odds.
- Add them: S = p(Home) + p(Draw) + p(Away).
- Treat S − 1 as the overround (the built-in margin).
- Normalize each outcome: p_no_vig(outcome) = p(outcome) / S.
- Check they total 1.00 after normalization.
If your “fair” probabilities don’t sum to 100%, you’re still pricing the book, not the match.
Draw mispricing risk
Draw prices are fragile because they sit on tactical assumptions. Pressing styles, red-card risk, and a single missing finisher can shift “drawishness” without moving win chances equally. A naive odds-to-probability conversion won’t catch that, because it only reflects the market’s current snapshot.
Treat the draw like a separate model input, not a leftover between home and away.
Comparison checklist
You need consistent market rules before comparing implied probabilities. Otherwise, you’re comparing different contracts with similar labels.
- Same market: 1X2 or Draw No Bet
- Same time period: regulation or full match
- Same extra-time rules: included or excluded
- Same settlement: voids, abandonments, replays
- Same handicap context: none vs Asian lines
If one rule differs, your “edge” can be just settlement drift.
Example 5: Parlays vs Singles
Parlays look like simple multiplication, so people expect the parlay price to match the singles math. It often doesn’t, because books price extra risk, rules, and correlation.
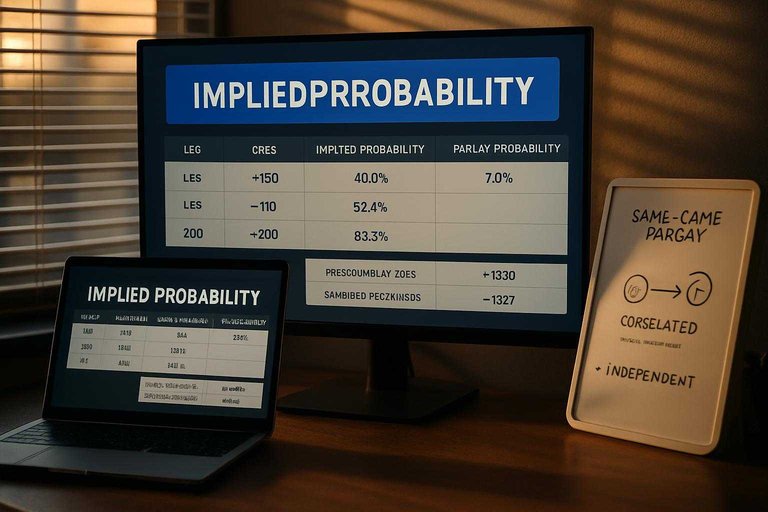
Multiply probabilities
Convert each leg to implied probability, multiply them, then convert back to implied odds.
- Convert each leg’s odds into implied probability.
- Multiply all leg probabilities to get parlay probability.
- Convert the parlay probability back into implied odds.
- Compare that “synthetic” odds to the posted parlay odds.
If the gap is big, the pricing isn’t just math.
Correlation reality
Same-game parlays break the independence assumption, so raw multiplication lies to you fast. If one leg makes the other more likely, or less likely, the true parlay probability shifts.
A basic implied-probability calculator can’t see correlation without a model, so treat it as a rough baseline. For more context on why SGPs can’t be priced like standard parlays, see this explainer on same-game parlay correlation.
What to compare
Use comparisons that expose pricing quirks before you commit.
- Posted parlay price vs synthetic multiplied price
- Legs available as singles vs parlay-only legs
- House rules on voids, pushes, and ties
- Maximum payout or stake constraints
You’re not just betting outcomes. You’re betting the rulebook.
Example 6: Player Props
A common player prop, like points or receptions, is really a break-even math problem. You convert the price into a required hit rate, then compare it to your true probability.
Imagine a points prop priced at -115. That price implies you need to be right often enough just to not lose money long-term.
Lines move fast because the market reacts to news and lineup context instantly. Most personal models lag because their inputs update slower.
Price to win rate
You need a repeatable way to turn a prop price into a required hit rate. Then you can check if your projection actually has edge.
- Convert American odds to implied probability.
- For negative odds: required = odds / (odds + 100).
- For positive odds: required = 100 / (odds + 100).
- Compare your projected hit rate to the required rate.
- Only bet when your projection clears it by a buffer.
Your “buffer” is where variance, juice, and bad assumptions get paid for.
Market context matters
Your probability estimate can be clean and still be wrong. Player props are fragile because roles change faster than most datasets.
Usage spikes when a high-usage teammate sits. Pace shifts when a coach shortens possessions.
If the context changed, your historical average is a souvenir, not a signal.
Data hygiene
Before you trust any implied probability edge, verify the inputs. Most “bad beats” start as bad assumptions.
- Projection source and update time
- Sample relevance to current role
- Opponent and matchup adjustments
- Minutes, rotations, and usage assumptions
Clean inputs beat clever math, almost every time.
Example 7: Live Betting
Live prices move fast, so implied probability is only useful if you can act before the number changes. You also have to survive latency, bet limits, and market suspensions that turn “correct” math into bad execution.
Convert on the fly
You need a conversion you can do in seconds, because the edge decays between seeing and clicking.
- Convert American odds to implied probability: favorites use odds/(odds+100); underdogs use 100/(odds+100).
- Convert decimal odds to implied probability: 1/decimal.
- Convert fractional odds to implied probability: denominator/(numerator+denominator).
- Compare to your fair probability and require a buffer for staleness.
- Pass if the line moved once during your check.
In live betting, your “edge” must cover latency first, not your ego.
What fails live
Live feeds can be accurate while still being late. By the time your implied probability shows value, the book may have already repriced.
Auto-traders also vacuum up obvious mispricings, and limits shrink right when volatility spikes. You end up holding the right number, but you can’t get it filled.
If you can’t consistently get matched near the price you computed, implied probability becomes a scoreboard, not a tool.
Practical guardrails
You need rules that protect you from execution risk, not just bad math.
- Set a max bet size per market.
- Cap time-to-confirm before you abort.
- Keep backup books open for comparison.
- Avoid markets with frequent suspensions.
The best live bettors are boring: they trade only where they can actually get filled.
Use These Examples as Your Pre-Bet Checklist
- Convert the odds to implied probability, then cross-check the format (American vs decimal) to catch input mistakes.
- Strip out vig when you’re comparing sides or books—normalize two-way and three-way markets before you judge “value.”
- Match the example to the market: totals need break-even math, parlays need probability multiplication (plus correlation reality), props need context and clean data, and live lines need guardrails.
- If you can’t explain what would make the price wrong (bad inputs, stale market, misread rules, or volatility), treat the calculation as a number—not a decision.