
 Best Platforms
 Live Odds







Next US President Markets vs Polls: Which Tracks Reality Faster?
A clear comparison of presidential prediction markets vs polling—what each actually measures, how quickly they update, and how to read signal through noise using update speed, information quality, coverage/granularity, and election-timing context.
When the news breaks, you want to know what’s changed first: the race itself—or just the conversation about it. Polls can lag, headlines can whipsaw, and a single flashy chart can make you overcorrect.
This comparison helps you interpret prediction markets and polls as different instruments, not rival crystal balls. You’ll see what “reality” and “faster” should mean in practice, where each source is most vulnerable, how to separate noise from signal, and how to combine both into a decision workflow as Election Day approaches.
What Each Measures
Prediction markets and polls both talk about elections, but they measure different things. Markets price a bet on an outcome; polls sample opinions at a moment. “Reality” is the actual election result, and “faster” is how quickly a tool reflects durable new information.
Markets in brief
Prediction markets trade contracts that pay out if an event happens. The price becomes an implied probability, because traders are buying and selling their beliefs.
A typical contract is simple: it pays $1 if Candidate A wins, and $0 otherwise. If it trades at 0.62, the market implies about a 62% chance. Prices move day to day with news, new data, liquidity, and who shows up to trade.
When money changes hands, weak opinions get punished fast.
Polls in brief
Polls are surveys that estimate what a larger electorate thinks. They use sampling to collect responses, then weighting to better match the population.
A topline like “Candidate A 48, Candidate B 46” is an estimate with uncertainty. It reflects question wording, turnout assumptions, and who actually answered. Most polls are trying to measure vote intention if the election were held now.
Polls are microscopes. They’re also snapshots, not movies.
Define “reality”
Elections create several “realities,” and only one ends the argument. Confusing them is how people claim a tool “failed.”
- Final outcome on election day
- Voter intention at survey time
- Campaign momentum and attention
- News-cycle heat and narrative
- Turnout and coalition shifts
If you don’t name the target, you can’t judge the tracker.
Define “faster”
“Faster” can mean reacting quickly, or being correct quickly. Those are not the same, especially in noisy weeks.
A fast tool updates immediately after new information. A useful tool holds that update when the story survives the next headline. Speed without durability is just volatility you can’t act on.
Track reaction speed. Then track how often it sticks.
Typical use cases
You use markets and polls for different jobs. Mixing the jobs creates bad takes and worse decisions.
- Forecasting the winner: markets help
- Checking narrative: polls help
- Monitoring coalitions: polls help
- Timing risk decisions: markets help
- Stress-testing assumptions: both help
Pick the tool based on the decision you’re trying to make.
Speed to Update
You want the signal that moves first when reality changes. Markets and polls both update, but they ingest new information at very different speeds.
| Trigger | Prediction markets | Polls | Faster in practice |
|---|---|---|---|
| Breaking news | Minutes to hours | Days to weeks | Markets |
| Debate night | Live repricing | Post-debate fieldwork | Markets |
| Candidate gaffe | Instant drift | Next polling wave | Markets |
| Major endorsement | Quick adjustment | Slow to detect | Markets |
| Data revision | Immediate reaction | Limited impact | Markets |
If you need the earliest read, watch markets first, then wait for polls to confirm or contradict (see differences in information assimilation).
What “updates faster” means to traders (latency, liquidity, spreads, and divergence)
In election pricing, “faster” isn’t just who reacts first—it’s whether you can actually trade the new information at a fair price. In practice, speed shows up in four places:
-
Data latency (quote freshness): A market can reprice quickly, but your edge depends on when the displayed odds last refreshed versus when the underlying order book moved. On aggregator views, always check the Last updated timestamp and be cautious during breaking news when quotes can change faster than page refresh intervals.
-
Liquidity and order-book depth: The first move often happens on thin size. If the best price is only available for a small fill, the “fast update” may be real but not very actionable. When depth is low, expect larger slippage and consider scaling in (or waiting) rather than hitting the entire position at once.
-
Bid–ask spread (tradeability): Wide spreads are a hidden delay. The mid-price may jump instantly, but if the spread widens, your executable price lags the headline move. Treat spread expansion as a signal that the market is uncertain or temporarily one-sided—especially right after debates, rulings, or surprise announcements.
-
Cross-platform divergence (where price discovery happens): Different venues can disagree for minutes or longer when news hits—because of different participant bases, funding rails, risk controls, or liquidity concentration. Divergence can create opportunity (buy the laggard / sell the leader) or just reflect worse execution on the “cheap” venue. Before acting, compare (1) implied odds across platforms, (2) volume and liquidity indicators, and (3) whether the spread is tight enough to survive fees and slippage.
Practical workflow: when the next us president headline changes, first look for which platform moved, then confirm the move is tradable (tight spread + real size), and finally watch whether other platforms converge or stay split—the convergence is often as informative as the initial jump.
Information Quality
Subsections: [
{
“subheading”: “Data sources”,
“content”: “Prediction markets ingest many signals indirectly. Prices absorb news, fundraising chatter, debate reactions, and traders’ private hunches.\n\nPolls measure voter intent directly. That directness matters when the story is stable but hidden from headlines.\n\nMarkets win on speed. Polls win on representativeness, when sampling is done well.”,
“description”: “What markets ingest indirectly vs what polls measure directly; why the difference matters.”
},
{
“subheading”: “Incentives and bias”,
“content”: “Each system pays for different behavior. Those incentives shape the error you see.\n\n- Profit rewards being early and right\n- Attention rewards loud, reactive narratives\n- Social desirability distorts stated preferences\n- Nonresponse skews who gets counted\n- Partisan framing nudges answers at the margin\n\nPolls drift when people won’t talk or won’t tell you. Markets drift when traders all chase the same story.\n\n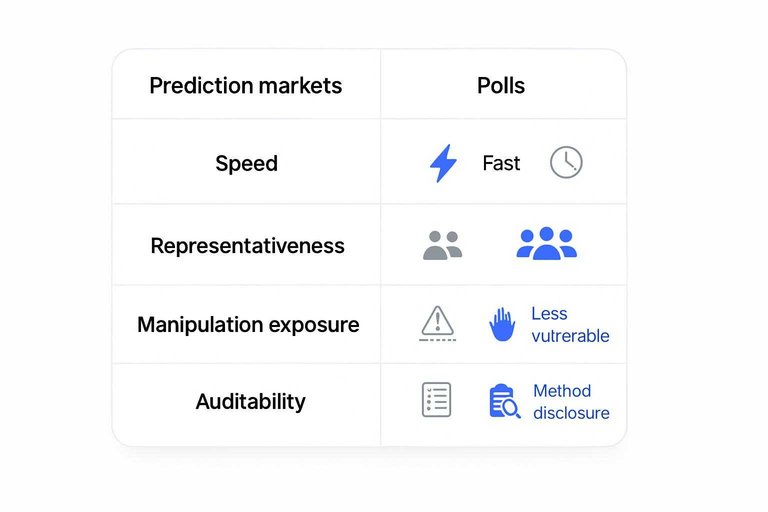 \n\n”,
“description”: “Profit motive vs social desirability and nonresponse; which pushes estimates off track.”
},
{
“subheading”: “Manipulation exposure”,
“content”: “Both can be pushed around. The question is how expensive the push is, and how long it lasts.\n\nThin liquidity makes markets easier to shove temporarily. A coordinated buyer can move the price, at least until others fade it.\n\nPolls face herding and partisan floods, but aggregation can dampen single-bad-survey effects. Markets are usually more vulnerable to deliberate, short-term manipulation.\n\nIf you want a practical framework for spotting these weaknesses, see <a href="https://marketsprediction.com/blog/president-market-limitations-in-2026-how-to-audit-election-contracts">how to audit election contracts.”,
“description”: “Thin liquidity, coordinated trading vs poll herding and partisan poll floods; name the more vulnerable.”
},
{
“subheading”: “Transparency and auditability”,
“content”: “You can only trust what you can inspect. Vetting favors the system that exposes its assumptions.\n\n| Dimension | Polls | Markets | Easier to vet |\n| — | — | — | — |\n| Method disclosure | Often published | Rulebook varies | Polls |\n| Microdata access | Sometimes limited | Trades often visible | Markets |\n| Weighting details | Sometimes shared | Implicit in price | Polls |\n| Incentive clarity | Respondent unclear | Money on line | Markets |\n\nPolls are easier to audit when they publish crosstabs and weighting. If they don’t, markets can look cleaner by default.”,
“description”: “Methodology disclosure, crosstabs, and weighting vs order books and exchange rules; decide who’s easier to vet.”
}
]
Noise vs Signal
Volatility patterns
Markets can whipsaw because they reprice instantly on headlines, positioning, and risk appetite. Polls can look calm for days, then jump when enough interviews land.
If you want the steadier day-to-day signal, polls usually win. Markets are faster, but often noisier in the short run.
Smoothing options
Use the same smoothing logic on both, but keep assumptions light.
- Pick a window length that matches your question.
- Use a simple rolling average for polls.
- Use a rolling median for market prices.
- Compare both to a longer baseline window.
- Only react when both shift together.
Poll smoothing is simpler because the units are already “vote-ish,” not “risk pricing.”
When signals persist
After debates or scandals, markets often move first, then fade as attention moves on. Polls tend to shift later, but a real change can stick once it shows up across multiple polls.
Useful persistence usually shows up more reliably in polling averages than in intraday prices. Speed is great, but durability pays.
Common misreads
Most bad takes come from treating noisy indicators like final answers. You can avoid them with a few hard rules.
- Treating a price spike as “certainty.”
- Treating one poll as “momentum.”
- Ignoring how thin some markets are.
- Ignoring poll mode and likely-voter screens.
- Confusing national swings with state outcomes.
The fix is boring: watch revisions, not reactions.
Coverage and Granularity
You’re choosing between breadth and detail. The right tool depends on whether you need a map, a microscope, or a simulator.
Here’s how markets and polls compare across national vs state coverage, subgroup insight, and scenario modeling.
| Need | Markets | Polls | Winner |
|---|---|---|---|
| National signal | Fast price synthesis | Broad toplines | Markets |
| State detail | Often thinner liquidity | Frequent state polls | Polls |
| Subgroup insight | Indirect, model-implied | Crosstabs, demographics | Polls |
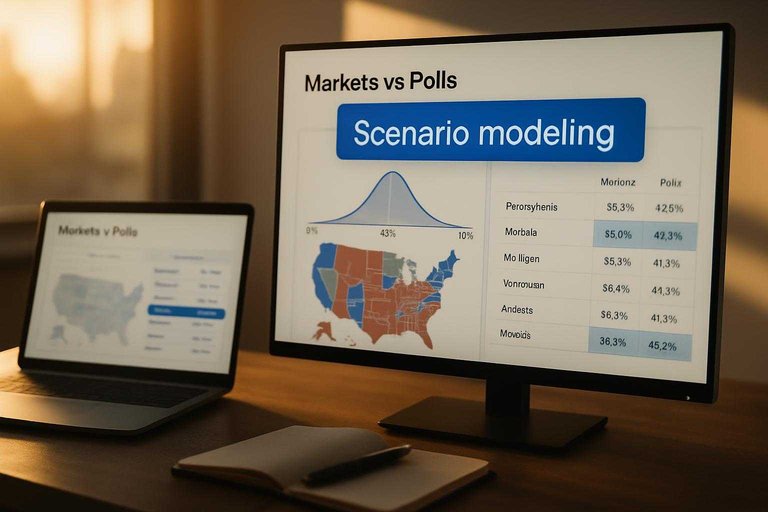
| Scenario modeling | Native probabilities | Requires aggregation | Markets |
Use polls to see who moves where. Use markets to see which path looks live.
Timing Before Election Day
Both polls and prediction markets change speed across the calendar. The trick is knowing when each signal is less polluted by noise.
Across the cycle, the “winner” flips. Use the phase, not your preference.
Early cycle
Early on, voters aren’t paying attention and campaigns are still forming. Markets can be more informative because they synthesize sparse signals into one probability.
A single poll bounce can be mostly name recognition, news churn, or sampling variance. A market price can still be wrong, but it usually forces a coherent story: who can win, and how.
Watch markets early if you want a baseline, then wait for polls to catch up (consistent with findings on markets vs polls further out).
Primary-to-general shift
This phase is full of discrete events, not smooth trends. The faster tool is the one that reprices without pretending the last dataset still applies.
- Markets adjust quickly to field changes and new nominees.
- Polls lag while new matchups get polled and weighted.
- Markets risk overreacting to headlines and momentum narratives.
- Polls risk overfitting via shaky likely-voter screens and crosstab mining.
- Markets win when uncertainty is structural, not just statistical.
If the race definition changes, treat polls as “delayed confirmation” and markets as “first draft.”
Final stretch
Late, the question stops being “who could win” and becomes “who will show up.” Polls usually track closing reality better because they directly measure preferences at scale.
Markets can still move faster, but they also price fear, vibes, and liquidity shocks. If turnout composition shifts, both can miss, but polls at least tell you where the persuadables and undecideds sit.
In the final weeks, polls are the better guide, and markets are the better alarm bell.
Election-eve interpretation
On election eve, you’re mostly translating two different languages into one decision rule.
- Treat a 55% market as a modest edge, not a near-lock.
- Translate a +2 poll lead into a range, not a point estimate.
- Assume “within error” means either outcome is normal, not shocking.
- Use polls to anchor your expectation, then use markets to sanity-check surprises.
- If they disagree, ask what’s unmeasured: turnout, late deciders, or state clustering.
When it’s close, polls are your map and markets are your weather report.
Practical Decision Guide
You’re choosing between two sensors: polls measure stated preference, markets price expected outcomes. Your goal determines which signal you treat as primary and which you use for alarms.
Use markets when you need fast, tradable expectations. Use polls when you need grounded measurement. Use both when you want fewer surprises.
If you need speed
You need the earliest read on shifting expectations, even if it’s noisy. Markets usually move first because money reacts before questionnaires finish.
- Track rapid news shocks and debate nights
- Watch expectation shifts between polling releases
- Monitor swing-state narratives in real time
- Follow uncertainty spikes after major events
- Use odds changes as an alert system
Winner: prediction markets for speed, but distrust them when liquidity looks thin or one story dominates.
If you need accuracy
You need the closest estimate to the eventual vote, not the quickest mood swing. Poll averages usually win here because they sample voters directly and smooth daily noise.
- Estimate vote share, not just winner
- Anchor forecasts weeks, not hours
- Compare states with consistent methodology
- Detect slow-moving demographic shifts
- Validate narratives with repeated sampling
Winner: poll averages for accuracy, because measurement beats pricing when hype gets loud.
Best combined workflow
You want speed without getting tricked by a thin market or a rogue poll. Pair a stable poll baseline with market sensitivity, then force double-checks when they disagree.
- Set your baseline using a reputable poll average.
- Watch market odds daily for sudden breaks from the baseline.
- Double-check when markets move hard without new major polls.
- Double-check when a poll swing appears without broad confirmation.
- Update your view only after two independent signals align.
Treat divergence as a diagnostic moment, not a reason to “pick a side.”
Bottom-line pick
Markets track perceived reality faster, because they reprice instantly on fresh information. Polls track measured reality more reliably, because they sample voters and average out noise.
Default choice: use poll averages as your anchor, and use markets as your early-warning system when the world changes fast.
Use Both—But Let Each Do Its Job
If you need the fastest read on shifting expectations, markets usually react first—but treat sharp moves as hypotheses until they persist or show up in multiple places. If you need a steadier estimate of voter intent and subgroup detail, polls (especially well-aggregated) are the better anchor, even if they update in bursts. The most reliable approach is to use polls for the baseline, markets for rapid change detection, and then cross-check the “why” with the underlying news, methodology, and breadth of sources. By Election Eve, prioritize convergence across both rather than any single last-minute spike.
Frequently Asked Questions
- Are next US president prediction markets more accurate than election forecast models like FiveThirtyEight-style aggregators?
- They’re different tools: prediction markets reflect tradable odds, while forecast models combine polls, fundamentals, and historical priors to produce probabilities. Comparing them fairly means tracking calibration (did 60% events happen ~60% of the time?) and looking at state-level calls, not just one headline number.
- How should I interpret next US president odds (e.g., 55%)—is that a prediction or a chance?
- It’s a probability estimate, not a guarantee: 55% means the candidate is slightly more likely than not to win, and upsets are still common. Treat it like weather odds—use it to understand risk, not to assume the outcome.
- Can prediction markets for the next US president be manipulated, and how would you spot it?
- Yes, prices can be pushed temporarily, but lasting distortion usually requires sustained buying against other traders’ incentives. Watch for sudden spikes with no confirming movement in multiple markets or major polling/forecast updates, followed by quick mean reversion.
- Which should I follow for next US president state-by-state outcomes—polls, markets, or something else?
- Use state poll averages and reputable election forecast models for consistent state probabilities, and use markets mainly for broad national outcomes or specific event contracts. Many “next US president” market prices are national and don’t reliably replace state-level modeling.
- What’s the best way to track the next US president in real time without getting whiplash from daily swings?
- Follow a small dashboard: a poll average, a forecast model’s win probability, and one major market price, checking changes on a set schedule (e.g., weekly) unless major news breaks. This reduces overreacting to short-term volatility while still catching genuine trend shifts.