
 Best Platforms
 Live Odds








US Senate Prediction Markets vs Polling Models: Which Fits Traders?
A trader-focused comparison of US Senate prediction markets and polling models—understand what each measures, how to read probabilities, which fits your time horizon and risk style, and how to account for real-world trading frictions.
If you’ve ever watched a Senate race probability swing on debate night and wondered whether it was “real” information or just noise, you’re not alone. Polling models and prediction markets can disagree loudly—and both can be right for different reasons.
This collection helps you choose the tool that matches how you trade. You’ll see what each signal actually measures, where errors creep in, how to size up probability moves, and which approach fits short-term catalysts versus slow-burn positioning—plus a checklist and playbook you can apply race by race.
How They Differ
Prediction markets and polling models both output probabilities for Senate races. They just manufacture those numbers in different ways. One is a tradable price. The other is a statistical estimate.
What Markets Measure
A prediction market price reflects what traders will pay now for a contract that settles later. People with better information, stronger conviction, or faster reactions have an incentive to push price toward what they think is true.
Liquidity matters because it decides whether beliefs actually show up in price:
- Deep order books dampen noise and reduce single-trader impact.
- Thin markets can lag news or swing on small orders.
- Fees, limits, and access shape who participates.
Contract terms also shape the probability signal:
- Settlement rule clarity reduces dispute risk.
- Event definition decides what “wins.”
- Timing determines exposure to late shocks.
Read the price as an incentive-weighted belief, not a pure vote forecast.
What Polling Models Measure
A polling model turns surveys into an estimate of vote share, then converts that into a win probability. Many models also add “fundamentals” like incumbency, national environment, and historical patterns.
The output depends on assumptions baked into the machinery:
- Which polls count, and how much.
- How to correct for house effects and nonresponse.
- How to set priors when polling is sparse.
- How to model correlated errors across states.
Uncertainty intervals are doing real work here. They admit the model can be wrong even when the mean looks confident.
Treat the probability as a conditional forecast: accurate only if the model’s assumptions hold.
Where Errors Come From
Both approaches fail in predictable ways, and traders should name the failure mode before sizing a bet.
- Thin liquidity distorts prices
- Manipulation risk creates head fakes
- Sampling error misses true electorate
- House effects bias poll averages
- Late swings outrun model updates
- Structural breaks break priors
If you can’t say which error dominates, you’re not forecasting. You’re guessing.
Interpreting Probabilities
A good probability forecast is calibrated, meaning events priced at 70% happen about 70% of the time. Sharpness is different. It’s how often you’re willing to make strong calls instead of living near 50%.
A 70% favorite still loses plenty in any small sample. That loss does not automatically falsify the forecast, but repeated misses at the same probability level do.
“Edge” for a trader is a gap between your probability and the market price, after fees and execution risk. If your 70% is the market’s 62%, you have a trade. If it’s the same, you don’t.
Your job is not to predict the winner. Your job is to buy mispriced odds.
Fit by Time Horizon
Your holding period decides which signal you can actually use. Markets often react first, while polling models usually move slower but steadier.
Very Short-Term
Debate nights and breaking news create fast repricing because traders hit bids and lift offers immediately. Polling models rarely update on that cadence, so they lag the first wave.
Imagine a headline-driven spike that fades by morning. Treat the first move as information, then wait for confirmation from follow-up reporting, sustained volume, or a second price push.
Your edge comes from not confusing a liquidity shock with a belief shift.
Weeks to Election
In the final stretch, polling models often win on stability and map-level coherence.
- Smooth daily noise into trend
- Incorporate new polls consistently
- Reduce overreaction to headlines
- Keep cross-state Senate map aligned
- Provide scenario-style probabilities
Use markets for timing, but use models for direction when the tape gets jumpy.
Months Out
Early on, both tools lean on assumptions more than fresh evidence. Fundamentals like baseline partisanship, candidate quality, fundraising proxies, and national mood tend to matter most.
Prediction markets can drift on thin liquidity and narrative trades. Polling models can look precise while resting on sparse, low-signal polls.
When data is scarce, size smaller or demand a bigger mispricing before you act.
Event-Driven Trades
Event trades work when you treat information as a decaying asset.
- Define the catalyst and what “resolved” means.
- Map the information path from event to price.
- Choose the instrument with enough liquidity.
- Set a time stop before the narrative fades.
- Plan the exit on resolution or decay.
If you can’t name the resolution point, you’re not trading an event.
For a practical refresher on how quoted prices relate to bids/asks, see Polymarket’s overview of prices and orderbook mechanics.
Fit by Risk Style
Your best tool depends on how you handle uncertainty when races tighten. Pick the approach that matches your drawdown tolerance, not your political intuition.
Conservative Traders
Polling-model consensus works best when you want stable base rates and fewer surprises. You’re trading the center of the distribution, not the tails.
Use it like a risk-control checklist:
- Start with a polling average or model consensus as your prior
- Size small, assume you’re late to new information
- Prefer liquid contracts with tight spreads and steady volume
- Skip thin markets where one order moves the price
Your edge comes from not blowing up, not from calling every close finish.
Opportunistic Traders
Markets shine when the information flow is messy and uneven. You’re looking for moments when price updates faster than models, or slower than reality.
Watch for these market-led trade setups:
- Polls look stale versus live news
- Sentiment shifts between polling waves
- Contracts drift without new data
- Spreads imply confused liquidity
- Related races price inconsistently
If you can name the missing update, you can often price the move.
Volatility Seekers
Prediction markets can gap on breaking news because the order book re-prices instantly. Polling models often smooth the same shock over time, which feels calmer but lags.
Think in variance, not direction:
- Assume your mark-to-market swings will be bigger than your thesis
- Treat binary contracts like compressed options with jump risk
- Expect liquidity to vanish right when you want out
- Cap risk with predefined exits, not “I’ll decide later”
If you can’t describe your exit before entry, you’re not trading volatility. You’re donating to it.
Hedgers and Arbitrage
Hedging works when you already have exposure and you want smaller drawdowns. Arbitrage works when two prices should move together but don’t.
- Identify your exposure in race outcomes and time horizon.
- Pick the hedge instrument: another contract, a basket, or a related market.
- Estimate correlation from shared drivers and update cadence.
- Size the hedge to reduce tail loss, not to hit zero variance.
- Monitor drift after polls, debates, filings, and major news.
Rebalance around scheduled updates, or your “hedge” becomes just another bet.
Practical Trading Frictions
Apparent edges in Senate markets often die on contact with execution. You’re not trading a forecast; you’re trading a contract with rules, costs, and limits.
| Friction | How it shows up | Who it hurts most | What to check |
|---|---|---|---|
| Liquidity | Wide spreads | Small-signal traders | Bid-ask depth |
| Position limits | Capped exposure | High-conviction traders | Contract caps |
| Fees | Per-trade drag | Frequent rebalancers | Fee schedule |
| Settlement rules | Ambiguous outcomes | Narrative traders | Resolution criteria |
| Timing | Slow repricing | Fast news traders | Market hours |
For a deeper look at why these issues can distort “odds” into noisy signals, see US Senate prediction market limitations in 2026.
If you can’t scale, exit, and settle cleanly, your “edge” is just a story.
Signal Quality Checklist
Use this checklist when you need to decide if a probability is tradable today, not just interesting. It forces you to separate “good signal” from “good story.”
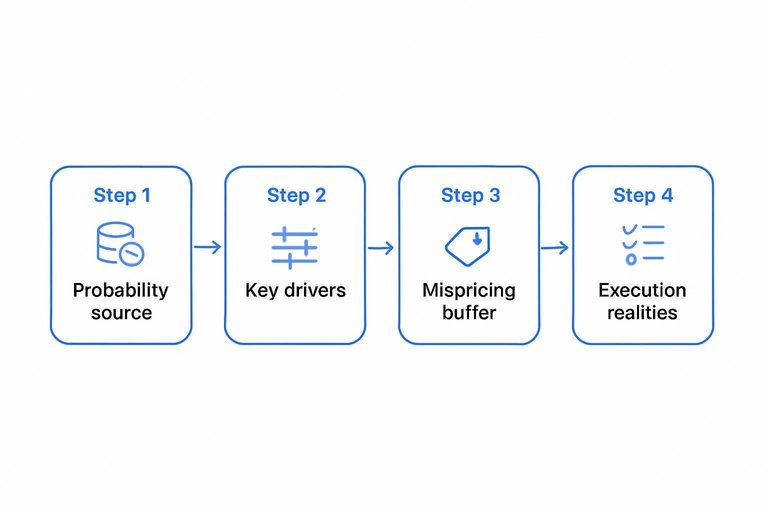
- Identify the probability source and update cadence, then check the timestamp.
- List the three strongest drivers of the number, then label each as new or stale.
- Compare market price to your model range, then demand a clear mispricing buffer.
- Stress-test the thesis against one plausible adverse scenario, then estimate if you’d still hold.
- Confirm execution realities: liquidity, spread, sizing limits, and your exit path.
If you can’t pass step three and step five, you’re analyzing, not trading.
If your “source” is a polling average, it helps to understand how polling averages are built before treating the output as tradable.
Use-Case Playbook
Directional Bets
You’re trying to be right on direction, not win a debate about methodology. Use market price when you need real-time aggregation, and use model probability when you need a disciplined read on the polling baseline.
If you follow the market, check the spread first. Wide bid-ask spreads can turn a “correct” call into a losing trade.
If you follow the model, check poll recency and update cadence. Old field dates can lag fast-moving narratives.
For either tool, map news sensitivity before you size up. A market often reprices on headlines, while a model usually waits for polls.
Trade the instrument that reacts to the risk you’re actually exposed to, not the one that feels smarter.
Value Hunting
You’re hunting mispricings, not picking winners. Start with situations where one system is likely stale, biased, or thin.
- Model-market divergence persists across days
- Model assumptions look outdated or fragile
- Low-quality polls flood recent averages
- Liquidity changes abruptly and stays thin
Verify the “edge” survives fees, spreads, and position limits. Paper edges die at the order book.
Portfolio Diversification
Single-source conviction is fragile, especially late in a cycle. Mixing markets and models diversifies your failure modes, not just your positions.
Use models to anchor a slow, methodical signal. Use markets to capture fast information and crowd risk pricing.
When they agree, you can size with more confidence. When they disagree, you can reduce exposure or shift to conditional setups.
The goal is resilience: one method can be wrong without taking your whole book with it.
Late-Cycle Positioning
Late cycle, the level matters less than the trend and the plumbing. Your job is to stay solvent when volatility spikes.
- Track trend versus level, and trade the change rate.
- Watch turnout and procedural news that can move settlement odds.
- Tighten stops and define invalidation points in advance.
- Reduce leverage as gaps and halts become more likely.
- Plan for election-night liquidity, including partial fills and wide spreads.
Treat election night like a liquidity event, not a normal trading session.
Clear Recommendation
Prediction markets fit you if you trade, hedge, or price risk for a position you can actually take. They turn belief into an executable number, with spreads, liquidity, and timing friction baked in.
Polling models fit you if you analyze, forecast, or build systems that need scenario control and explainable drivers. You get state-by-state structure, assumptions you can stress-test, and uncertainty you can decompose.
Default: start with prediction markets for trading decisions, then switch to polling models when market prices look distorted by low liquidity, venue limits, or a sudden narrative rush. If you can’t trade the market you’re reading, treat it as a signal, not an anchor.
Regulatory, Venue, and Contract Mechanics That Decide What You Can Actually Trade
Before comparing edge between a model and a market, confirm you can access a compliant venue and that the contract you’re looking at settles the way you think it does. For a US Senate prediction, the biggest “fit” factor is often not signal quality—it’s whether election contracts are listed where you live, what the exchange is permitted to offer, and how the contract’s rules translate real-world outcomes into payout.
Two traders can hold the same view on a race and still have completely different opportunities (or risks) depending on venue access, listing permissions, and contract structure. That’s why it’s worth treating regulation and mechanics as a first-pass filter rather than an afterthought.
Where election markets are (and aren’t) available
Election contracts are not universally listed across all prediction-market venues, and availability can change based on regulatory posture and venue policy. In the U.S., some election-related contracts may be offered only on CFTC-regulated platforms (for example, Kalshi as a designated contract market), while other platforms may restrict U.S. users or avoid election listings entirely.
What to check before you build a strategy:
- Your jurisdiction and eligibility: Many venues geofence or restrict onboarding by country/state, and some brokers/exchanges may limit certain contract categories.
- Whether the market is actually live and liquid: Even if a venue lists “politics,” specific US Senate markets may be absent, delayed, capped, or too thin to trade efficiently.
- Product scope: Some venues focus on national outcomes; others may list selected state races; many won’t list every seat.
If you can’t legally access a venue that lists the contract you want, your “prediction” may be academically interesting but not tradable.
Kalshi/CFTC context: why it matters for traders
If you’re using a regulated U.S. venue, the main practical impact of CFTC oversight is that products tend to come with formal rulebooks, defined settlement sources, and standardized contract terms. That structure can reduce ambiguity—but it can also constrain what markets exist and how they’re designed.
Implications for traders:
- Product availability can be limited: Election-related contracts may face tighter scrutiny, narrower definitions, or fewer listed outcomes.
- Contract terms are non-negotiable: You’re trading the listed spec, not “your” version of the event.
- Operational rules matter: Position limits, holding limits, or other controls can affect scaling, hedging, and whether you can express a portfolio view.
This isn’t about one regime being “better.” It’s about recognizing that regulation shapes the menu of tradable US Senate prediction markets—and the constraints often change the optimal trading approach.
Election-market limits you must plan around
Even on venues that support election markets, they may come with constraints that don’t exist in typical sports or crypto-style prediction markets.
Common constraints to look for:
- Position/contract limits: Caps can prevent you from sizing up when your edge is strongest or from running multi-seat baskets.
- Market coverage limits: You may only get a subset of competitive races or only “headline” outcomes.
- Trading-hour and order-type differences: Some venues have different hours, different order types, or different matching behavior than what you’re used to in equities/crypto.
These constraints can flip the decision between “use a prediction market” vs “use a polling model and express the view elsewhere” (for example, through correlated assets or simply by staying in analysis mode).
Settlement rules: the hidden edge (or hidden trap)
Settlement is where a US Senate prediction becomes a real contract with real risk. Always read the market rules for how the event is defined and who determines the outcome.
Settlement mechanics to verify:
- What exactly is being measured: Popular definitions include “party wins the seat,” “candidate X wins the seat,” or “party controls the Senate after the election.” Each has different path risk.
- What counts as ‘winning’: Is it based on certified results, the winner being sworn in, or a specific authority’s announcement? Does it include special elections, runoffs, recounts, or legal challenges?
- Source of truth: The contract should specify the official sources used for settlement (e.g., a named government authority or formal certification). If the source is vague, you’re taking rule risk.
- Timing: Some contracts settle quickly; others may remain open until certification. Long settlement windows create capital tie-up and headline risk.
A polling model can be continuously updated; a contract settles once. That asymmetry is why rule clarity is part of “fit.”
Contract specs: payout, pricing, and what you’re really buying
Not all prediction contracts behave the same way. Two markets can both look like “probability” but have different economic exposure.
Key specs that affect trading:
- Binary vs multi-outcome: Binary markets (Yes/No) are straightforward; multi-outcome markets can embed complexity in how you hedge or arbitrage.
- Payout structure: Many contracts function like a binary that pays a fixed amount if true and zero if false. Your P&L depends on entry price, fees, and whether you hold to settlement or trade in/out.
- Fees and spread: Fees can turn small theoretical edges into negative expectancy; wide spreads can make timing and order placement more important than the forecast itself.
- Early exit vs hold-to-settle: Some traders rely on trading around probability swings. If the market is illiquid, you may be forced into a hold-to-settle posture even if you intended to trade tactically.
Treat the contract like any other instrument: you’re not just forecasting the Senate—you’re trading a specific payoff function with specific frictions.
A quick pre-trade checklist for tradability
Use this when deciding whether your US Senate prediction belongs in a market or stays in a model:
- Can I legally access a venue listing the exact contract I want?
- Is there enough liquidity to enter and exit without donating edge to spreads?
- Do I understand the settlement authority, timing, and edge cases (recounts, runoffs, vacancies)?
- Are there position limits or rules that will prevent scaling or hedging?
- Do fees and contract design still leave room for my expected edge?
If any answer is unclear, default to “don’t trade yet”—and resolve the rule/mechanics first. That discipline often matters more than choosing between polling and prediction markets.
Pick Your Primary Signal, Then Cross-Check for Entries
Use prediction markets when you’re trading execution—short-term catalysts, sentiment shifts, and the price you can actually get—because the market is the tradable consensus. Use polling models when you’re trading estimation—baseline fundamentals, slow-moving trends, and where uncertainty is plausibly mispriced. In practice, choose one as your “truth source,” then use the other as a cross-check: model–market gaps for value hunting, and market moves against model stability for timing and risk control. If you can’t explain a probability change in plain language (what changed, for whom, and why now), treat it as noise and size down.
Frequently Asked Questions
- Are US Senate prediction markets more accurate than polling models for forecasting races?
- Not consistently. Prediction markets can incorporate news and positioning quickly, while polling models tend to be steadier and can outperform when market prices get distorted by liquidity, fees, or trader bias.
- How do I tell if a US Senate prediction market price is being driven by real information or just low liquidity?
- Check order book depth, bid–ask spread, and whether the price jumps on tiny volume; then compare the move to credible triggers like new polls, filings, or major campaign news. If the price leads without a clear catalyst and trading is thin, it’s often noise rather than signal.
- Can I build my own US Senate prediction model from polling data instead of using a public forecast?
- Yes—start with poll aggregation (adjusting for recency and pollster quality) and translate the polling margin into win probability using a simple error model. Validate it by backtesting on past cycles and stress-testing assumptions like house effects and undecided voter allocation.
- What are the biggest pitfalls when using polling for US Senate predictions in close races?
- Small-sample polling noise, late-breaking shifts, and correlated errors across states can make probabilities look more precise than they are. Watch for sparse recent polling, inconsistent likely-voter screens, and heavy reliance on one pollster or one mode (phone vs online).
- How do I sanity-check a US Senate prediction against fundamentals like incumbency, fundraising, and candidate quality?
- Use fundamentals as a plausibility filter, not a replacement: if the probability implies an outcome that contradicts fundraising, incumbency, and past partisan lean, demand stronger evidence like consistent polling movement. Cross-check with public data sources (FEC filings, election results, reputable race ratings) to see whether the narrative matches the number.