
 Best Platforms
 Live Odds







How to Track “Marco Rubio for President” Odds: 7 Best Practices
A practical guide to tracking “Marco Rubio for President” odds without fooling yourself—compare odds vs. implied probability, choose reliable market sources, standardize formats, monitor liquidity and event context, and build an auditable tracker with clear dos and don’ts.
If you’ve ever checked political odds and felt whiplash, you’re not alone. The same candidate can look “up” on one market and “down” on another, simply because the data isn’t comparable—or the market is thin.
This guide shows you how to track “Marco Rubio for President” odds in a disciplined way. You’ll learn which sources to trust, how to convert everything into one consistent format, what signals matter beyond the headline price, and how to log changes so your takeaways stay grounded.
Set the Ground Rules
“Odds” are market prices for a specific contract, not a crystal ball. They reflect trader beliefs, liquidity, rules, and incentives. Track them as signals, not truth, and keep your work ethical and compliant.
Odds vs probability
Odds are a price format, and probability is what that price implies after math. Both can move fast because markets reprice uncertainty, not because reality changed. Treat odds like a snapshot of sentiment under a rulebook, not a forecast or endorsement.
American odds (e.g., +250, -150) and decimal odds (e.g., 3.50, 1.67) are just different wrappers for the same idea. Implied probability is the conversion of that wrapper into a percent-like number, and it often includes vig, fees, or spread. That makes “implied probability” a market signal, not a clean estimate of real-world chances.
Your job is to model what the contract means, then interpret the price—never the other way around.
Know market types
Different contracts answer different questions, even when the headline names the same person. If you don’t name the contract, you’ll argue past people.
- Nomination winner: wins party nomination
- General election winner: wins presidency
- Primary state win: wins a specific state contest
- VP pick: selected as running mate
- Conditional markets: outcome given another event
Pick the contract first, or you’ll mistake a side bet for a main thesis.
Stay compliant
Political betting and prediction markets are regulated unevenly, and rules change by jurisdiction. Your age, location, and the platform’s terms can make the same action allowed or prohibited. Read the platform rules, follow local law, and avoid any approach that looks like evasion.
When you share outputs, frame them as research or education, not instructions to wager. Don’t encourage risky behavior, don’t target minors, and don’t present “odds” as guaranteed outcomes. If you’re publishing, add clear sourcing, timestamps, and a plain disclaimer about uncertainty.
If you can’t explain it responsibly, you shouldn’t track it publicly.
Decide your timeframe
Set your cadence before headlines tempt you into doom-refreshing.
- Choose intraday tracking for debates, indictments, or major endorsements.
- Choose daily tracking for active primary weeks and polling releases.
- Choose weekly tracking for quiet stretches and long horizons.
- Add event-based checks for filings, withdrawals, and ballot deadlines.
- Write one rule for exceptions, so you don’t “just peek” forever.
Your cadence is your filter; build it to match decisions, not anxiety.
Pick Reliable Sources
Track odds where the market is liquid, the pricing is transparent, and the rules are stable. Thin, opaque venues can move on one trade, which makes your “signal” mostly noise.
| Source type | What you get | What to verify | Red flags |
|---|---|---|---|
| Major prediction market | Tradable odds | Volume, spread | Wide spread |
| Regulated exchange feed | Cleaner execution | Rulebook clarity | Frequent halts |
| Aggregator dashboard | Cross-market view | Method disclosed | Hidden weighting |
| Bookmaker lines | Public prices | Limits, vig | Sudden delist |
| Polling average feed | Non-market context | Update cadence | Cherry-picked polls |
If two independent, liquid sources disagree, dig into the contract rules before trusting either price. For a plain-English baseline on what “stable rules” and settlement terms should look like, see the CFTC’s guide to understanding prediction markets and event contracts.
Standardize Your Odds Format
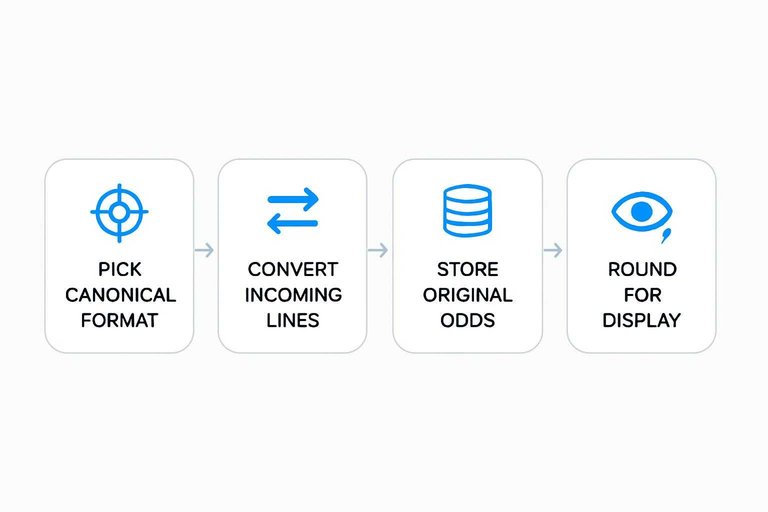
You can’t compare odds across sites if each one speaks a different “math dialect.” Standardizing one canonical format prevents quiet, compounding mistakes.
- Pick one canonical format for storage, usually implied probability.
- Convert every incoming line into that format before you compare anything.
- Store the original odds too, plus the source and timestamp.
- Record the market type and unit, like decimal, American, or contract price.
- Round only for display, never for calculation.
Once you normalize early, every chart and alert becomes trustworthy.
Track the Right Signals
Odds move for two reasons: new information or thin trading. Your job is to tell which is which, fast, and without fooling yourself.
Track a small set of market signals that explain most moves. Ignore the rest.
Price and spread
Mid-price is your cleanest snapshot because it blends the best bid and best ask. The bid-ask spread is the market admitting uncertainty, or a lack of competition.
When spreads widen, small trades can shove the displayed price around. Your chart may look “eventful” while the market is simply thin.
Treat wide spreads as higher tracking error, not higher conviction. For definitions and mechanics, see Polymarket’s explainer on prices and the order book.
Liquidity and volume
Capture the flow and the capacity, not just the last trade price.
- Total volume per interval
- Open interest level and change
- Order book depth near mid
- Large prints and timing
Low liquidity exaggerates moves, so validate every “spike” against depth and prints.
Time and event tags
Odds without context are just a seismograph with no map. Tag moves to real-world catalysts so you can separate narrative from noise.
- Log the timestamp, venue, and contract symbol.
- Tag debates, filings, endorsements, and rulings immediately.
- Add macro news tags only when timing is tight.
- Note whether the move happened on volume or on air.
- Keep a short “why it moved” sentence per tag.
If you can’t explain a move in one line, assume microstructure first.
Cross-market checks
Single-contract tracking is brittle because each market has its own quirks. Cross-check related contracts, like nomination odds versus general election odds, to see if the story matches.
If one market jumps and the adjacent one doesn’t budge, suspect a liquidity blip or stale quotes. If you see an arbitrage-looking gap, treat it as a data-quality alarm before a political insight.
Consistency beats cleverness when money is thin.
Build a Simple Tracker
You want a tracker you can update in minutes, not a fragile dashboard that breaks when a page layout changes. Build a workflow you can repeat on any device: capture what you see, store it in a consistent log, normalize it into one schema, then chart.
Skip iframe-style embeds and “live” widgets. For political contracts like marco rubio for president, what matters is having a defensible time series you can recreate later—especially when different venues show different prices, liquidity, and update times.
Spreadsheet setup
Set up the spreadsheet once so every update becomes a predictable routine.
- Create a Sources tab with: source name, URL, access method (web/manual export/API if allowed), and your check cadence.
- Add a Raw Pulls tab that logs each pull as a new row (never overwrite): pull timestamp (UTC), source URL, market/contract text as displayed, odds as displayed, plus any “last updated” time shown.
- Add a Normalized Odds tab where you convert everything into one consistent schema (one row per source per timestamp).
- Create a Notes tab for event context and data-quality flags (renamed contracts, halted markets, obvious bad prints, etc.).
- Build a Charts tab that only reads from Normalized Odds, not Raw Pulls.
If your charts touch Raw Pulls, your tracker will eventually fail on a messy paste, a renamed contract, or a format change.
Data fields to store
Store the minimum fields that let you compare markets across platforms and explain moves later.
- Market (event)
- Contract (exact wording)
- Platform / source
- Odds (as displayed)
- Odds format (e.g., percent, price, American)
- Implied probability (your normalized value)
- Liquidity (as displayed) or liquidity note (e.g., “thin”)
- Volume (if shown)
- Spread / best bid–ask (if shown)
- Pull timestamp (when you captured it)
- Source “last updated” timestamp (if provided)
- Event note / flag
Without pull timestamps and source last-updated times, you can’t tell whether two platforms actually disagree—or you’re just comparing stale data to fresh data.
Chart the trend
Charts turn your log into a story you can sanity-check fast. Use a line chart for implied probability, because it compares cleanly across odds formats.
- Keep probability on its own chart or primary axis.
- Put liquidity/volume/spread on a separate chart (or a secondary axis) so you don’t confuse price movement with market quality.
- Add annotations for major context shifts: debates, endorsements, filings, major news cycles, or widely discussed withdrawal/entry rumors.
Price without context is noise; annotations tell you what the market reacted to and whether the move happened on real depth or a thin book.
Automate carefully
Automation should reduce typing, not create silent errors. The goal is “boring reliable” capture you can audit.
- Start with a manual snapshot routine (copy key rows into Raw Pulls) until your schema is stable.
- Add lightweight automation only where it’s robust: browser “copy table” exports, scheduled reminders, or scripts that ingest a saved CSV/JSON file you download yourself.
- If you use an API where allowed, record the endpoint, parameters, and response fields you rely on so a future change doesn’t quietly corrupt your series.
- Validate every run: check that timestamps parse, probabilities are in range, and the contract text still matches what you think you’re tracking.
- Log failures as rows (error + timestamp) and keep a manual override path for one-off corrections.
A good rule: if you can’t explain where a number came from in 30 seconds, the automation is too brittle.
Version and audit
Odds data changes under you, and corrections happen. Keep periodic snapshots of your normalized sheet, plus a simple change log for edits and methodology tweaks.
When a market updates contract wording, a platform revises how it reports liquidity/volume, or you change your normalization rules, you can rerun the logic and still reproduce what you saw that day.
If you cannot reproduce a number, you cannot defend your conclusion.
Apply Proven Dos and Don’ts
Tracking “Marco Rubio for President” odds is less about prediction and more about disciplined reading. Your job is to reduce bias, avoid false signals, and communicate uncertainty without sounding evasive.
Do: triangulate
Triangulation keeps you from treating one noisy signal as truth.
- Compare odds across multiple markets
- Check multiple platforms for the same contract
- Read market rules and settlement criteria
- Track the campaign calendar and deadlines
- Note debate, filing, and ballot events
If two sources disagree, your next move is rule-reading, not guesswork.
Don’t: overreact
Odds move fast, but meaning moves slow.
- Treat single-trade spikes as suspect
- Avoid headline-by-headline chasing
- Don’t ignore wide bid-ask spreads
- Don’t assume correlation proves causation
When the spread is wide, you’re watching uncertainty, not consensus.
Do: use thresholds
You need alert rules that filter noise before you publish updates. Use a simple trigger like “price moved by X%” plus a minimum liquidity check, such as recent volume or tighter spreads, so one small trade cannot hijack your narrative.
Set separate thresholds for “watch,” “update,” and “explain,” then stick to them. The moment you override thresholds for a juicy headline, you’ve stopped tracking and started storytelling.
Don’t: cherry-pick
Bias often shows up in what you omit, not what you say.
- Predefine your tracking window and snapshot times.
- Save every snapshot, including boring days.
- Record the same fields each time: price, spread, volume, timestamp.
- Report both favorable and unfavorable moves.
- Add a short note when you break your protocol.
If you can’t show the full series, you’re curating a case, not monitoring a market.
Put Your Tracking on Autopilot (Without Losing the Plot)
- Define your rules first: market type, timeframe, and what you will/won’t treat as signal.
- Use multiple reputable sources: log the same timestamp across sources to avoid false “moves.”
- Normalize the numbers: convert all odds to a single format and implied probability before comparing.
- Record context, not just price: note liquidity/volume, event tags, and any cross-market confirmations.
- Review with thresholds: act only on meaningful changes, and keep an audit trail so your tracker stays honest over time.
Frequently Asked Questions
- Are “Marco Rubio for president” betting odds the same as a prediction that he will win the election?
- No—odds reflect market pricing and sentiment, not a definitive forecast. They can move with news, liquidity, and trader behavior even when the underlying reality hasn’t changed much.
- Where can I see historical “Marco Rubio for president” odds and compare them across platforms?
- Use platforms that provide an odds history chart or an API/data export, then log snapshots into a spreadsheet or database for cross-site comparisons. If a site doesn’t publish history, use your own scheduled snapshots rather than relying on memory or screenshots.
- How do I convert “Marco Rubio for president” odds into implied probability correctly?
- Convert the odds format you’re viewing into implied probability using the standard formula for that format (e.g., decimal: 1/odds). If the market has multiple candidates, normalize probabilities or account for the market overround so the totals don’t mislead you.
- What should I watch besides the headline odds to understand a “Marco Rubio for president” odds move?
- Look at trading volume, order book depth, bid–ask spread, and whether the move holds across multiple liquid venues. A price change without supporting volume or depth is often less informative than a move backed by sustained trading.
- How often should I update my “Marco Rubio for president” odds tracker during the election cycle?
- Update on a consistent schedule (daily or weekly) and add event-driven updates around major announcements, debates, primaries, and big news cycles. Consistency makes trends interpretable, while event snapshots help you attribute jumps to specific catalysts.